29
/
en
AIzaSyAYiBZKx7MnpbEhh9jyipgxe19OcubqV5w
April 1, 2024
138849
Georgia
GEO
true
2
1
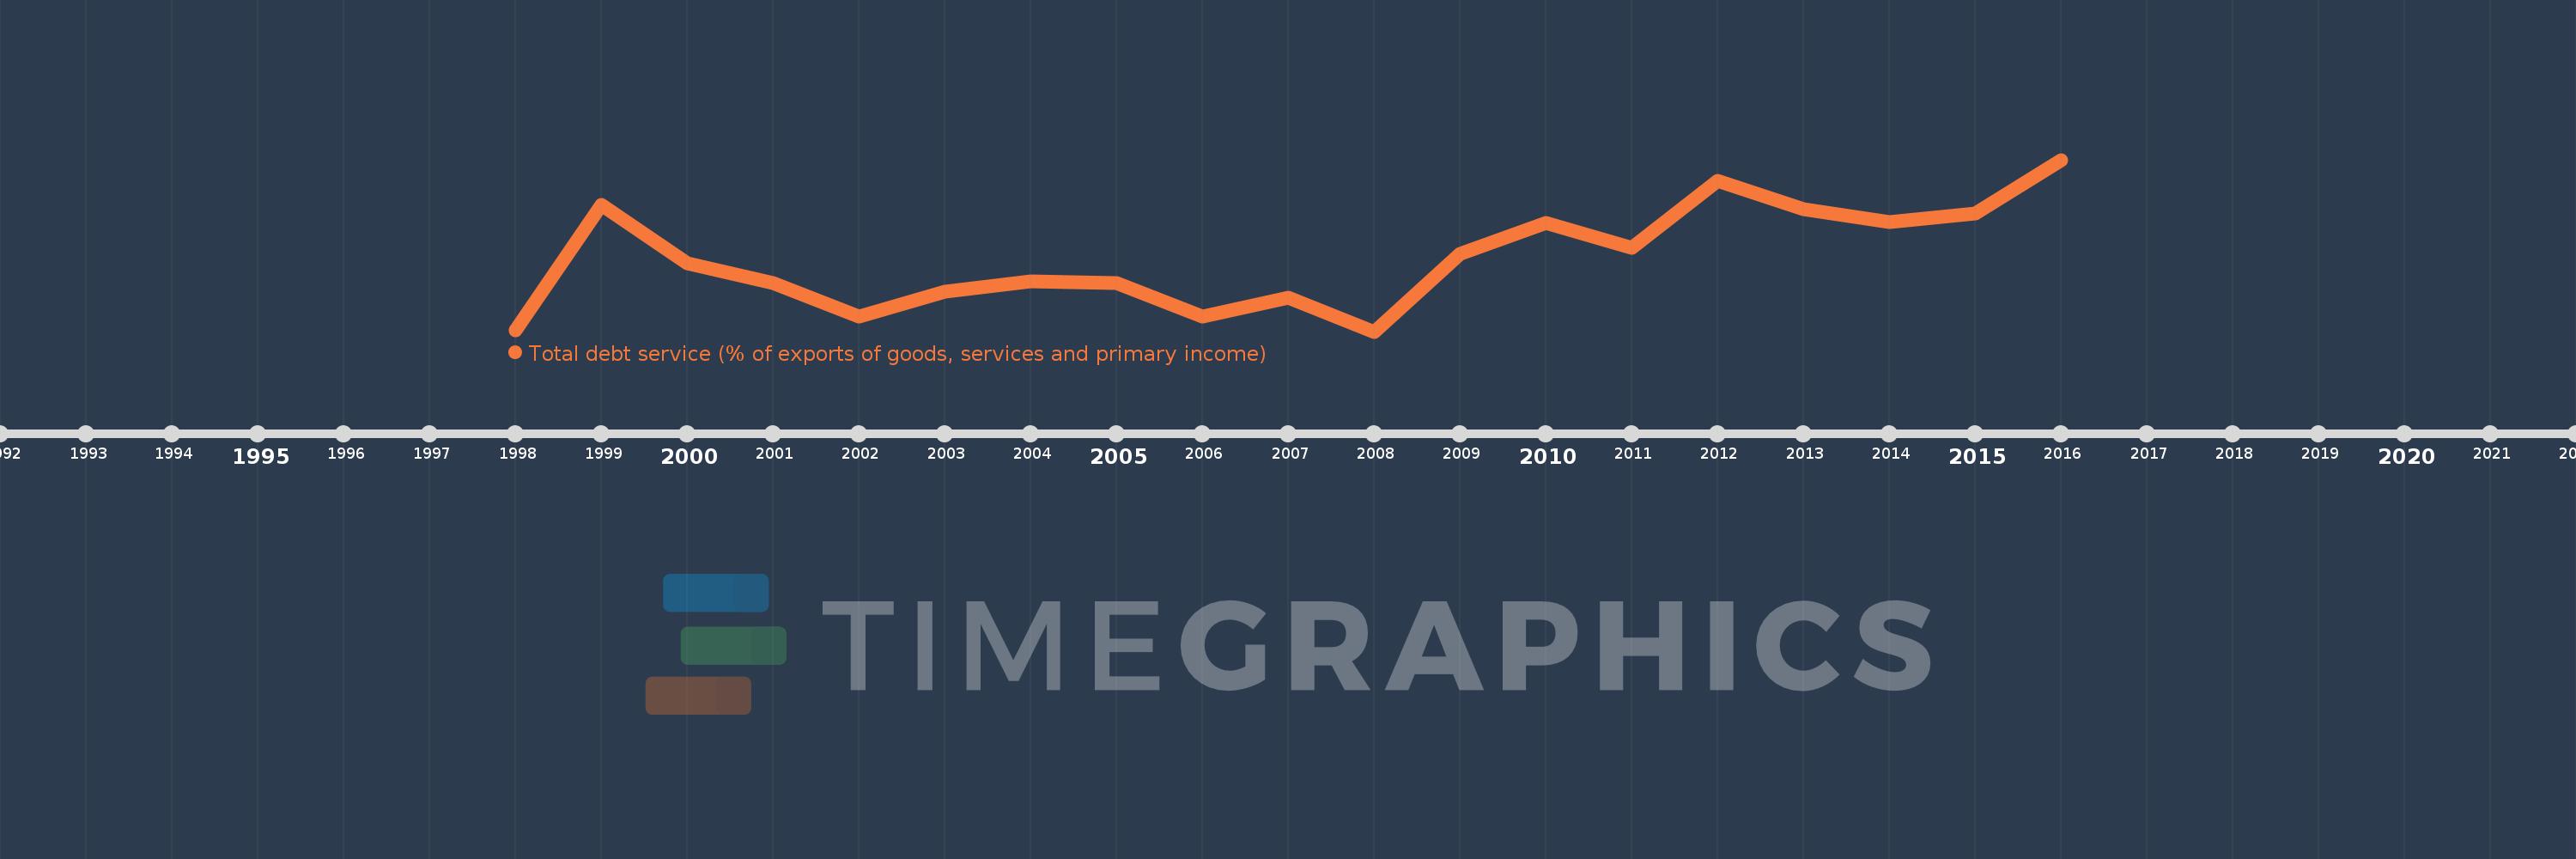
Total debt service (% of exports of goods, services and primary income)
2016,2015,2014,2013,2012,2011,2010,2009,2008,2007,2006,2005,2004,2003,2002,2001,2000,1999,1998
This statistics in other country:
Timeline:
This timeline shows a graph from 1998 to 2016 of Georgia. No data until 1997. Number of actual observations by date: 19.
Source name:
World Development Indicators
Source organization:
World Bank, International Debt Statistics.
Categories, topics:
Economy & Growth, External Debt
Last updated:
apr 23, 2017
Indicators value changes by year
Maximum:
29.655
jan 1, 2016
At the date of observation
Value
Absolute change
Change from previous value
jan 1, 1998
6.098
+6.098
0.0%
jan 1, 1999
23.393
+17.295
283.62%
jan 1, 2000
15.322
-8.071
-34.5%
jan 1, 2001
12.674
-2.648
-17.28%
jan 1, 2002
8.026
-4.648
-36.67%
jan 1, 2003
11.486
+3.46
43.11%
jan 1, 2004
12.847
+1.36
11.84%
jan 1, 2005
12.701
-0.146
-1.13%
jan 1, 2006
8.064
-4.637
-36.51%
jan 1, 2007
10.679
+2.615
32.43%
jan 1, 2008
5.962
-4.717
-44.17%
jan 1, 2009
16.726
+10.764
180.54%
jan 1, 2010
20.959
+4.233
25.31%
jan 1, 2011
17.502
-3.457
-16.5%
jan 1, 2012
26.761
+9.259
52.9%
jan 1, 2013
22.852
-3.909
-14.61%
jan 1, 2014
21.009
-1.843
-8.06%
jan 1, 2015
22.238
+1.229
5.85%
jan 1, 2016
29.655
+7.417
33.35%
Ranking of countries by current statistics by years


Comments: