29
/
en
AIzaSyAYiBZKx7MnpbEhh9jyipgxe19OcubqV5w
April 1, 2024
86197
Bhutan
BTN
true
2
1
Manufacturing, value added (constant LCU)
2016,2015,2014,2013,2012,2011,2010,2009,2008,2007,2006,2005,2004,2003,2002,2001,2000,1999,1998,1997,1996,1995,1994,1993,1992,1991,1990,1989,1988,1987,1986,1985,1984,1983,1982,1981
This statistics in other country:
AfghanistanAlbaniaAlgeriaAntigua and BarbudaArgentinaArmeniaAustraliaAustriaAzerbaijanBahamas, TheBahrainBangladeshBelarusBelgiumBelizeBeninBermudaBhutanBoliviaBosnia and HerzegovinaBotswanaBrazilBrunei DarussalamBurkina FasoBurundiCabo VerdeCambodiaCameroonCanadaCayman IslandsCentral African RepublicChadChileColombiaComorosCongo, Dem. Rep.Congo, Rep.Costa RicaCote d'IvoireCroatiaCubaCyprusCzech RepublicDenmarkDjiboutiDominicaDominican RepublicEcuadorEgypt, Arab Rep.El SalvadorEquatorial GuineaEritreaEstoniaEthiopiaFijiFinlandFranceGabonGambia, TheGeorgiaGermanyGhanaGreeceGrenadaGuatemalaGuineaGuyanaHaitiHondurasHong Kong SAR, ChinaHungaryIcelandIndiaIndonesiaIran, Islamic Rep.IraqIrelandItalyJamaicaJapanJordanKazakhstanKenyaKiribatiKorea, Rep.KosovoKuwaitKyrgyz RepublicLao PDRLatviaLebanonLesothoLiberiaLibyaLithuaniaLuxembourgMacedonia, FYRMadagascarMalawiMalaysiaMaldivesMarshall IslandsMauritaniaMauritiusMexicoMicronesia, Fed. Sts.MoldovaMongoliaMontenegroMoroccoMozambiqueMyanmarNamibiaNepalNetherlandsNew ZealandNicaraguaNigerNigeriaNorwayOmanPakistanPalauPanamaPapua New GuineaParaguayPeruPhilippinesPolandPortugalPuerto RicoQatarRomaniaRussian FederationRwandaSamoaSao Tome and PrincipeSaudi ArabiaSenegalSerbiaSeychellesSierra LeoneSingaporeSlovak RepublicSloveniaSolomon IslandsSomaliaSouth AfricaSpainSri LankaSt. Kitts and NevisSt. LuciaSt. Vincent and the GrenadinesSudanSurinameSwazilandSwedenSwitzerlandSyrian Arab RepublicTajikistanTanzaniaThailandTimor-LesteTogoTongaTrinidad and TobagoTunisiaTurkeyTuvaluUgandaUkraineUnited Arab EmiratesUnited KingdomUnited StatesUruguayUzbekistanVanuatuVenezuela, RBVietnamWest Bank and GazaZambiaZimbabwe Timeline:
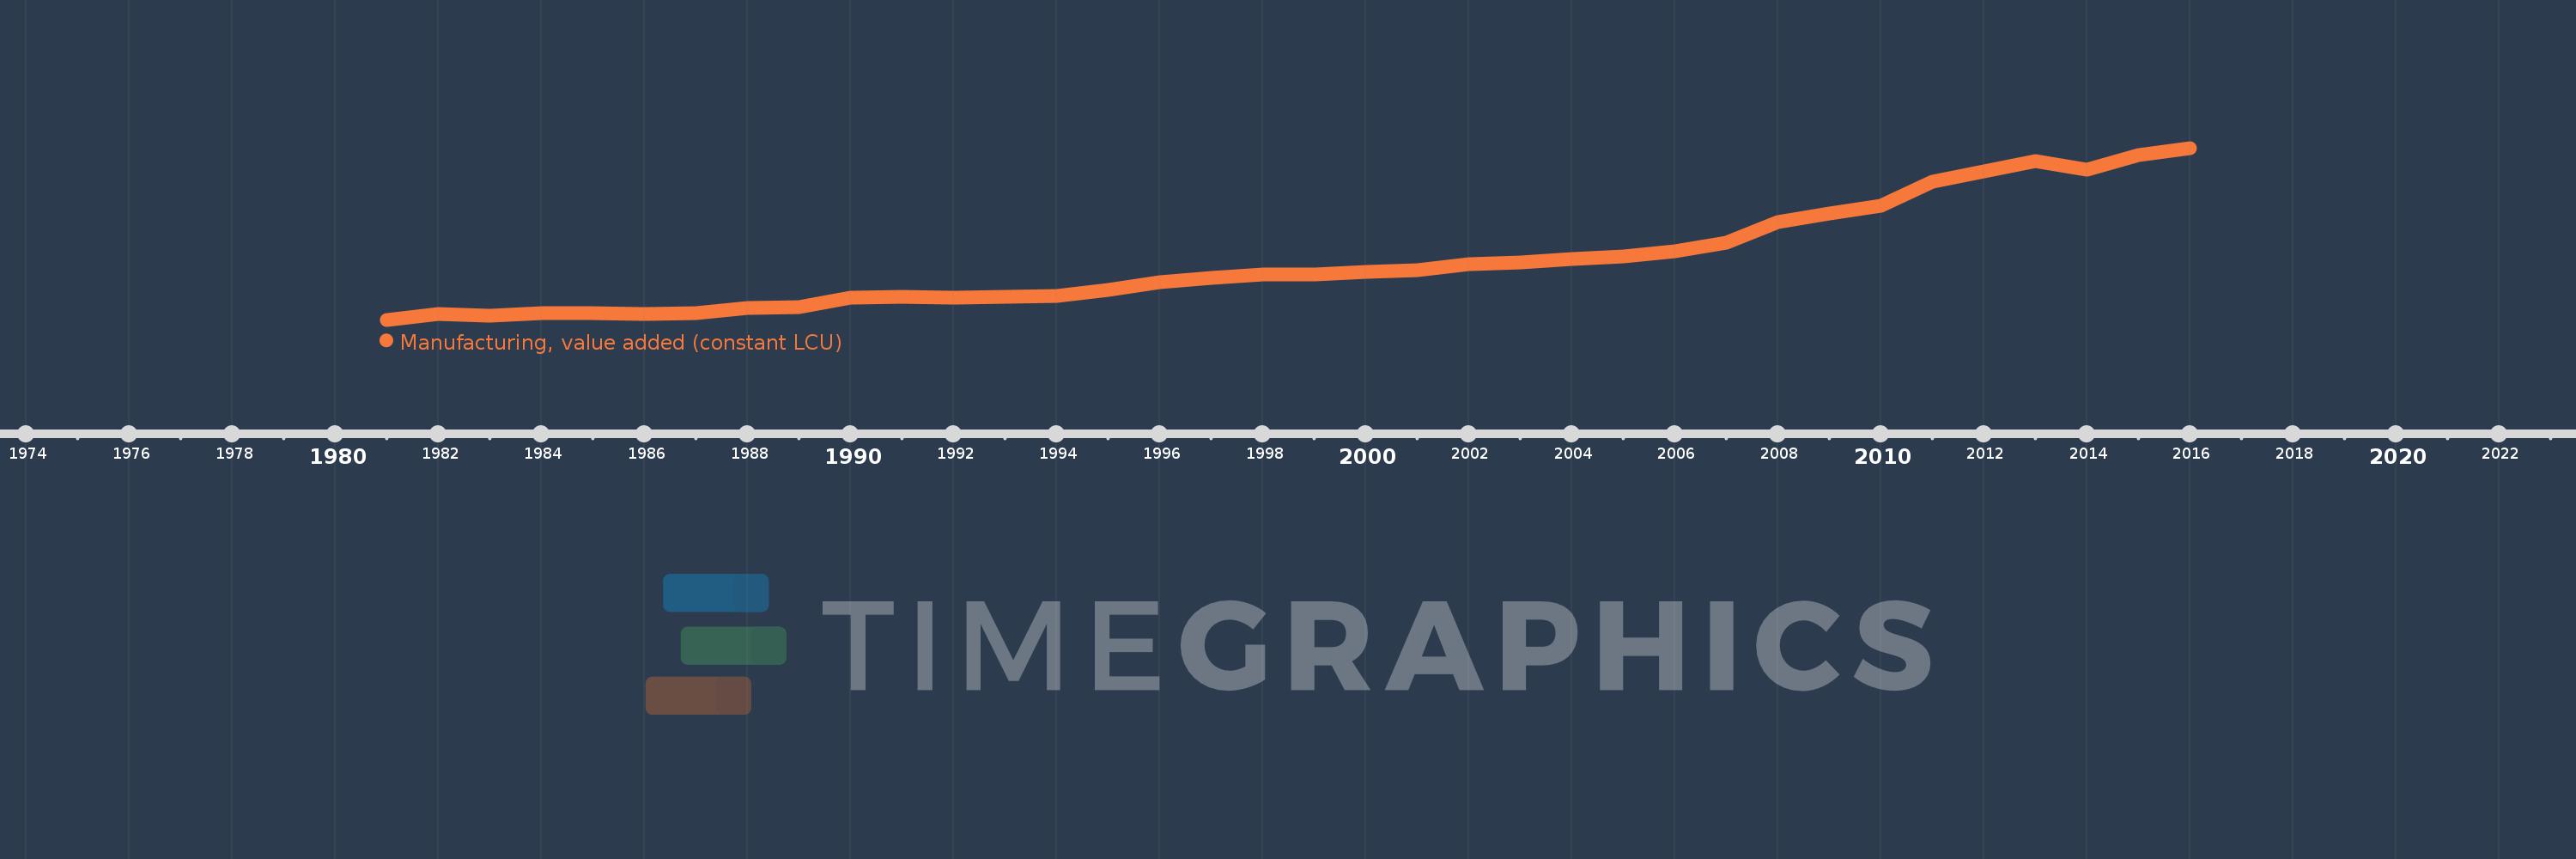
This timeline shows a graph from 1981 to 2016 of Bhutan. No data until 1980. Number of actual observations by date: 36.
Source name:
World Development Indicators
Source organization:
World Bank national accounts data, and OECD National Accounts data files.
Categories, topics:
Economy & Growth
Last updated:
apr 23, 2017
Indicators value changes by year
Minimum:
133.167 mln
jan 1, 1981
Maximum:
5.324 bln
jan 1, 2016
At the date of observation
Value
Absolute change
Change from previous value
jan 1, 1981
133.167 mln
+133.167 mln
0.0%
jan 1, 1982
304.626 mln
+171.459 mln
128.75%
jan 1, 1983
249.194 mln
-55.432 mln
-18.2%
jan 1, 1984
333.557 mln
+84.364 mln
33.85%
jan 1, 1985
338.495 mln
+4.938 mln
1.48%
jan 1, 1986
319.939 mln
-18.556 mln
-5.48%
jan 1, 1987
322.986 mln
+3.047 mln
0.95%
jan 1, 1988
479.072 mln
+156.086 mln
48.33%
jan 1, 1989
512.058 mln
+32.986 mln
6.89%
jan 1, 1990
801.024 mln
+288.966 mln
56.43%
jan 1, 1991
825.768 mln
+24.744 mln
3.09%
jan 1, 1992
797.359 mln
-28.409 mln
-3.44%
jan 1, 1993
831.588 mln
+34.229 mln
4.29%
jan 1, 1994
847.645 mln
+16.057 mln
1.93%
jan 1, 1995
1.023 bln
+175.165 mln
20.66%
jan 1, 1996
1.258 bln
+235.077 mln
22.98%
jan 1, 1997
1.403 bln
+145.122 mln
11.54%
jan 1, 1998
1.503 bln
+100.281 mln
7.15%
jan 1, 1999
1.503 bln
+47.0K
0.0%
jan 1, 2000
1.576 bln
+72.965 mln
4.85%
jan 1, 2001
1.619 bln
+42.552 mln
2.7%
jan 1, 2002
1.821 bln
+201.792 mln
12.47%
jan 1, 2003
1.855 bln
+34.601 mln
1.9%
jan 1, 2004
1.967 bln
+112.044 mln
6.04%
jan 1, 2005
2.055 bln
+87.74 mln
4.46%
jan 1, 2006
2.214 bln
+159.352 mln
7.75%
jan 1, 2007
2.469 bln
+254.32 mln
11.48%
jan 1, 2008
3.087 bln
+618.097 mln
25.04%
jan 1, 2009
3.349 bln
+262.614 mln
8.51%
jan 1, 2010
3.58 bln
+230.449 mln
6.88%
jan 1, 2011
4.302 bln
+722.535 mln
20.18%
jan 1, 2012
4.616 bln
+314.01 mln
7.3%
jan 1, 2013
4.93 bln
+313.59 mln
6.79%
jan 1, 2014
4.671 bln
-259.0 mln
-5.25%
jan 1, 2015
5.099 bln
+427.82 mln
9.16%
jan 1, 2016
5.324 bln
+225.07 mln
4.41%
Ranking of countries by current statistics by years


Comments: