29
/
en
AIzaSyAYiBZKx7MnpbEhh9jyipgxe19OcubqV5w
April 1, 2024
247791
Spain
ESP
true
2
1
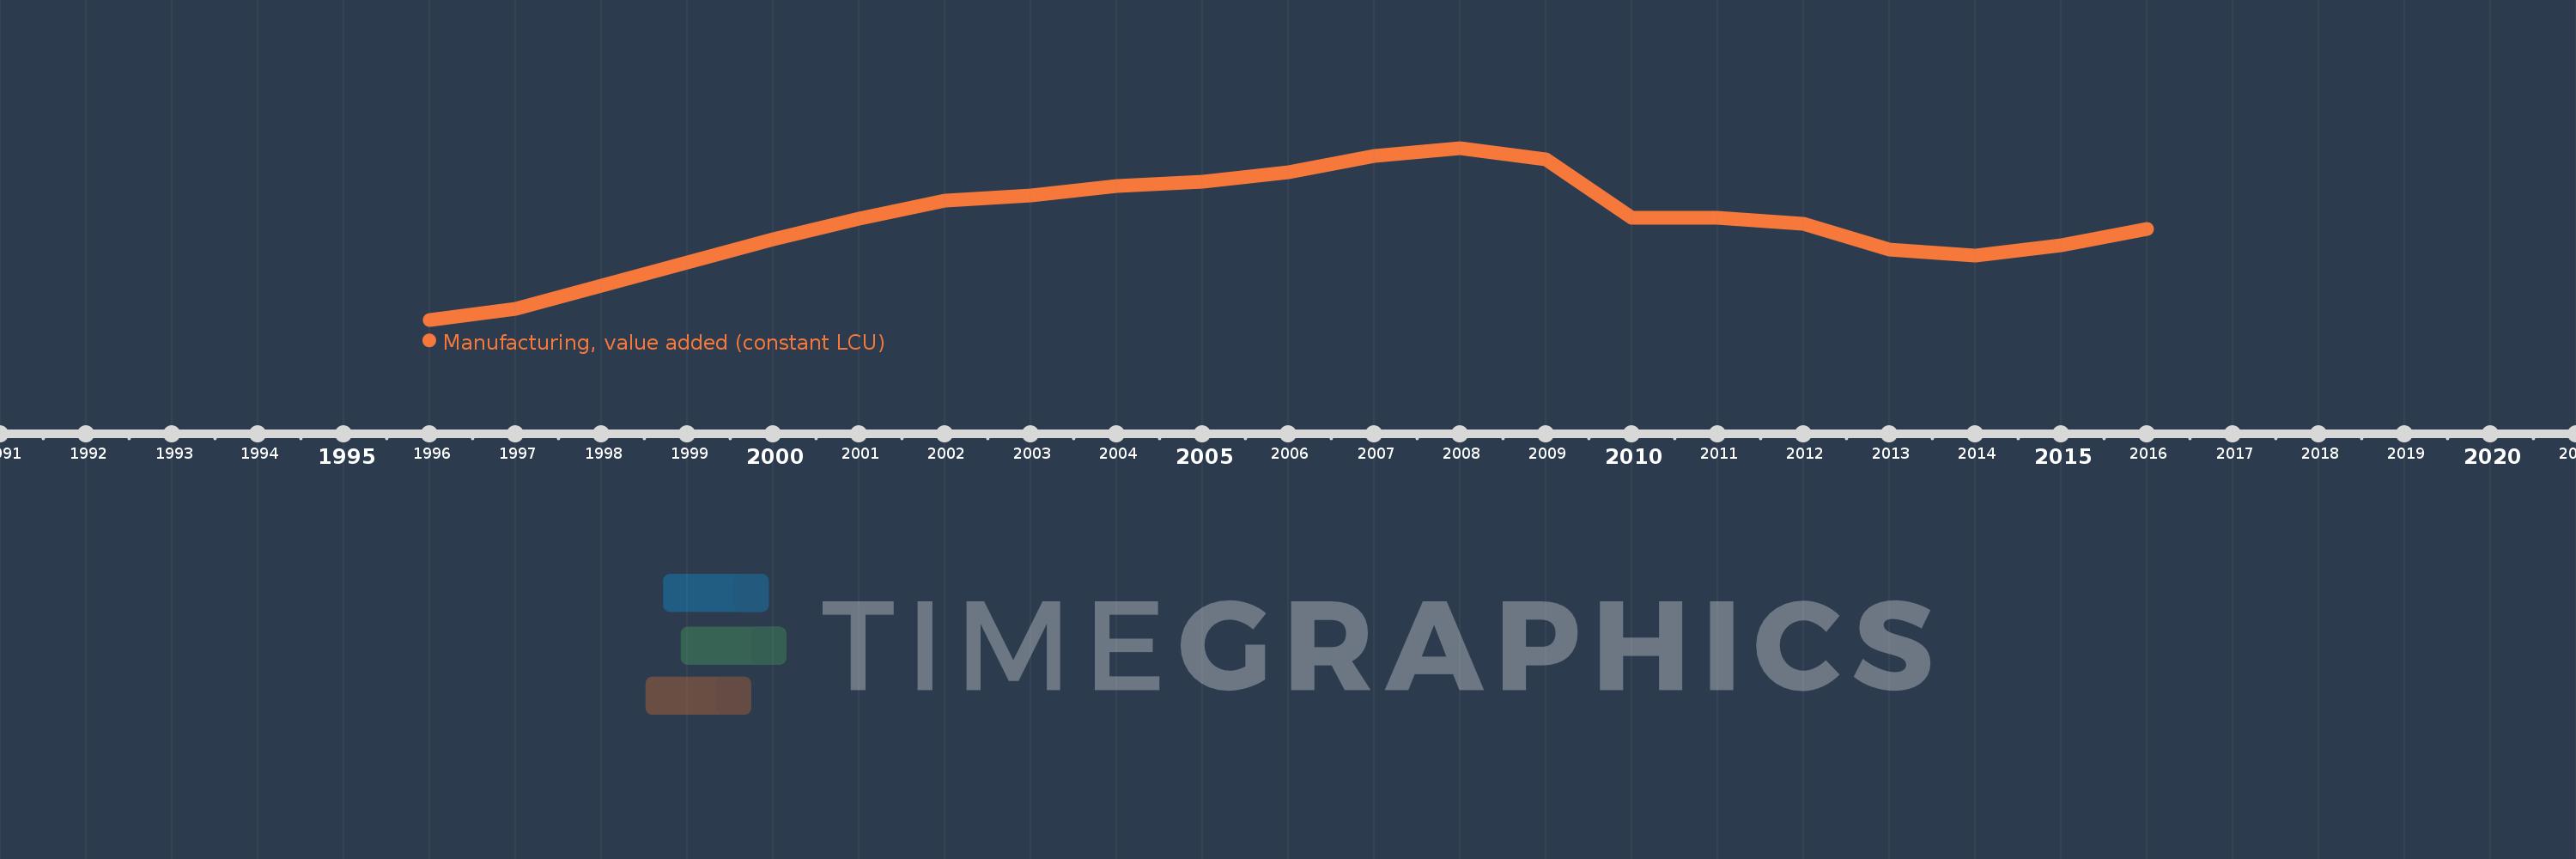
Manufacturing, value added (constant LCU)
2016,2015,2014,2013,2012,2011,2010,2009,2008,2007,2006,2005,2004,2003,2002,2001,2000,1999,1998,1997,1996
This statistics in other country:
AfghanistanAlbaniaAlgeriaAntigua and BarbudaArgentinaArmeniaAustraliaAustriaAzerbaijanBahamas, TheBahrainBangladeshBelarusBelgiumBelizeBeninBermudaBhutanBoliviaBosnia and HerzegovinaBotswanaBrazilBrunei DarussalamBurkina FasoBurundiCabo VerdeCambodiaCameroonCanadaCayman IslandsCentral African RepublicChadChileColombiaComorosCongo, Dem. Rep.Congo, Rep.Costa RicaCote d'IvoireCroatiaCubaCyprusCzech RepublicDenmarkDjiboutiDominicaDominican RepublicEcuadorEgypt, Arab Rep.El SalvadorEquatorial GuineaEritreaEstoniaEthiopiaFijiFinlandFranceGabonGambia, TheGeorgiaGermanyGhanaGreeceGrenadaGuatemalaGuineaGuyanaHaitiHondurasHong Kong SAR, ChinaHungaryIcelandIndiaIndonesiaIran, Islamic Rep.IraqIrelandItalyJamaicaJapanJordanKazakhstanKenyaKiribatiKorea, Rep.KosovoKuwaitKyrgyz RepublicLao PDRLatviaLebanonLesothoLiberiaLibyaLithuaniaLuxembourgMacedonia, FYRMadagascarMalawiMalaysiaMaldivesMarshall IslandsMauritaniaMauritiusMexicoMicronesia, Fed. Sts.MoldovaMongoliaMontenegroMoroccoMozambiqueMyanmarNamibiaNepalNetherlandsNew ZealandNicaraguaNigerNigeriaNorwayOmanPakistanPalauPanamaPapua New GuineaParaguayPeruPhilippinesPolandPortugalPuerto RicoQatarRomaniaRussian FederationRwandaSamoaSao Tome and PrincipeSaudi ArabiaSenegalSerbiaSeychellesSierra LeoneSingaporeSlovak RepublicSloveniaSolomon IslandsSomaliaSouth AfricaSpainSri LankaSt. Kitts and NevisSt. LuciaSt. Vincent and the GrenadinesSudanSurinameSwazilandSwedenSwitzerlandSyrian Arab RepublicTajikistanTanzaniaThailandTimor-LesteTogoTongaTrinidad and TobagoTunisiaTurkeyTuvaluUgandaUkraineUnited Arab EmiratesUnited KingdomUnited StatesUruguayUzbekistanVanuatuVenezuela, RBVietnamWest Bank and GazaZambiaZimbabwe Timeline:
This timeline shows a graph from 1996 to 2016 of Spain. No data until 1995. Number of actual observations by date: 21.
Source name:
World Development Indicators
Source organization:
World Bank national accounts data, and OECD National Accounts data files.
Categories, topics:
Economy & Growth
Last updated:
apr 23, 2017
Indicators value changes by year
Minimum:
103.442 bln
jan 1, 1996
Maximum:
150.688 bln
jan 1, 2008
At the date of observation
Value
Absolute change
Change from previous value
jan 1, 1996
103.442 bln
+103.442 bln
0.0%
jan 1, 1997
106.368 bln
+2.926 bln
2.83%
jan 1, 1998
112.871 bln
+6.503 bln
6.11%
jan 1, 1999
119.292 bln
+6.421 bln
5.69%
jan 1, 2000
125.46 bln
+6.168 bln
5.17%
jan 1, 2001
131.288 bln
+5.828 bln
4.65%
jan 1, 2002
136.254 bln
+4.966 bln
3.78%
jan 1, 2003
137.617 bln
+1.363 bln
1.0%
jan 1, 2004
140.25 bln
+2.633 bln
1.91%
jan 1, 2005
141.412 bln
+1.162 bln
0.83%
jan 1, 2006
144.011 bln
+2.599 bln
1.84%
jan 1, 2007
148.571 bln
+4.56 bln
3.17%
jan 1, 2008
150.688 bln
+2.117 bln
1.42%
jan 1, 2009
147.531 bln
-3.157 bln
-2.1%
jan 1, 2010
131.433 bln
-16.098 bln
-10.91%
jan 1, 2011
131.436 bln
+3.0 mln
0.0%
jan 1, 2012
129.72 bln
-1.716 bln
-1.31%
jan 1, 2013
122.801 bln
-6.919 bln
-5.33%
jan 1, 2014
121.144 bln
-1.657 bln
-1.35%
jan 1, 2015
123.822 bln
+2.678 bln
2.21%
jan 1, 2016
128.443 bln
+4.621 bln
3.73%
Ranking of countries by current statistics by years


Comments: