29
/
en
AIzaSyAYiBZKx7MnpbEhh9jyipgxe19OcubqV5w
April 1, 2024
193267
Mauritania
MRT
true
2
1
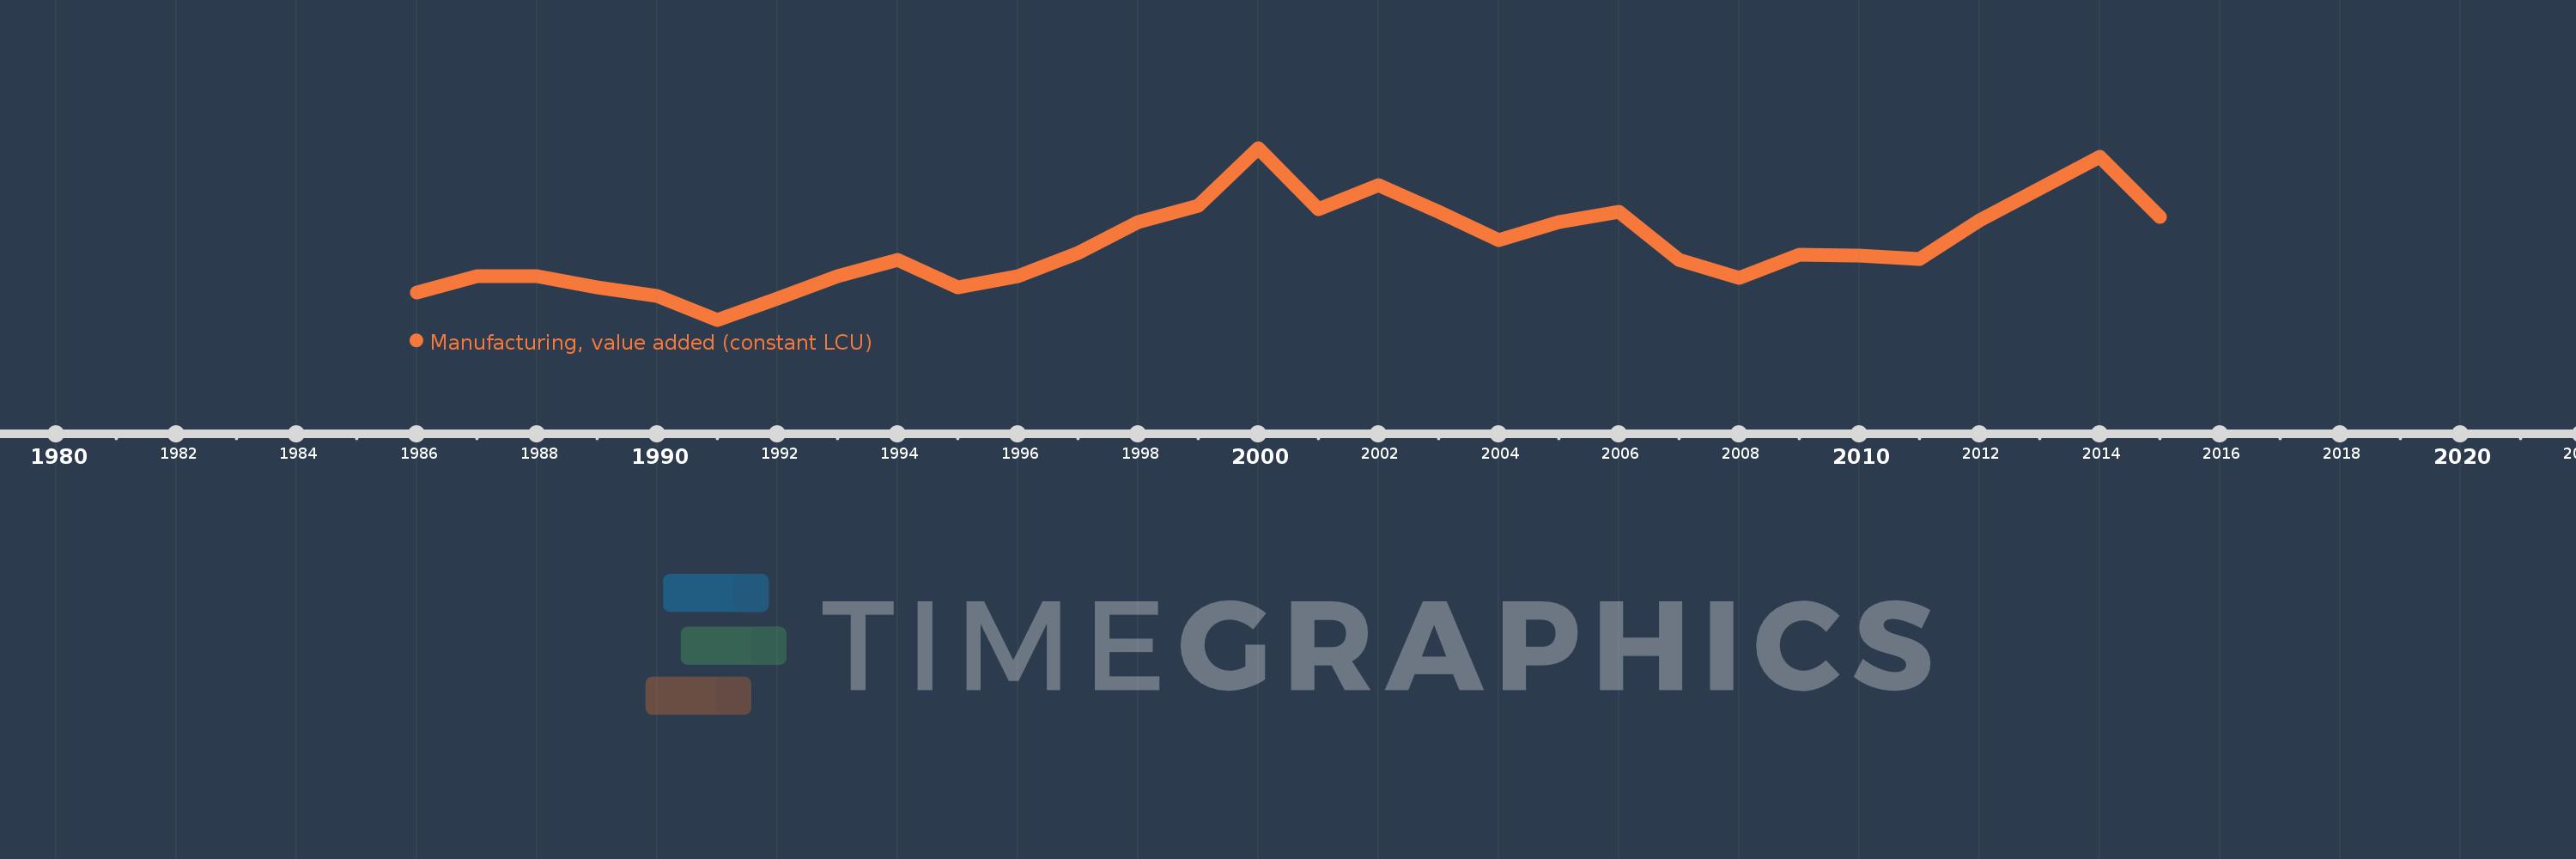
Manufacturing, value added (constant LCU)
2015,2014,2013,2012,2011,2010,2009,2008,2007,2006,2005,2004,2003,2002,2001,2000,1999,1998,1997,1996,1995,1994,1993,1992,1991,1990,1989,1988,1987,1986
This statistics in other country:
AfghanistanAlbaniaAlgeriaAntigua and BarbudaArgentinaArmeniaAustraliaAustriaAzerbaijanBahamas, TheBahrainBangladeshBelarusBelgiumBelizeBeninBermudaBhutanBoliviaBosnia and HerzegovinaBotswanaBrazilBrunei DarussalamBurkina FasoBurundiCabo VerdeCambodiaCameroonCanadaCayman IslandsCentral African RepublicChadChileColombiaComorosCongo, Dem. Rep.Congo, Rep.Costa RicaCote d'IvoireCroatiaCubaCyprusCzech RepublicDenmarkDjiboutiDominicaDominican RepublicEcuadorEgypt, Arab Rep.El SalvadorEquatorial GuineaEritreaEstoniaEthiopiaFijiFinlandFranceGabonGambia, TheGeorgiaGermanyGhanaGreeceGrenadaGuatemalaGuineaGuyanaHaitiHondurasHong Kong SAR, ChinaHungaryIcelandIndiaIndonesiaIran, Islamic Rep.IraqIrelandItalyJamaicaJapanJordanKazakhstanKenyaKiribatiKorea, Rep.KosovoKuwaitKyrgyz RepublicLao PDRLatviaLebanonLesothoLiberiaLibyaLithuaniaLuxembourgMacedonia, FYRMadagascarMalawiMalaysiaMaldivesMarshall IslandsMauritaniaMauritiusMexicoMicronesia, Fed. Sts.MoldovaMongoliaMontenegroMoroccoMozambiqueMyanmarNamibiaNepalNetherlandsNew ZealandNicaraguaNigerNigeriaNorwayOmanPakistanPalauPanamaPapua New GuineaParaguayPeruPhilippinesPolandPortugalPuerto RicoQatarRomaniaRussian FederationRwandaSamoaSao Tome and PrincipeSaudi ArabiaSenegalSerbiaSeychellesSierra LeoneSingaporeSlovak RepublicSloveniaSolomon IslandsSomaliaSouth AfricaSpainSri LankaSt. Kitts and NevisSt. LuciaSt. Vincent and the GrenadinesSudanSurinameSwazilandSwedenSwitzerlandSyrian Arab RepublicTajikistanTanzaniaThailandTimor-LesteTogoTongaTrinidad and TobagoTunisiaTurkeyTuvaluUgandaUkraineUnited Arab EmiratesUnited KingdomUnited StatesUruguayUzbekistanVanuatuVenezuela, RBVietnamWest Bank and GazaZambiaZimbabwe Timeline:
This timeline shows a graph from 1986 to 2015 of Mauritania. No data until 1985. Number of actual observations by date: 30.
Source name:
World Development Indicators
Source organization:
World Bank national accounts data, and OECD National Accounts data files.
Categories, topics:
Economy & Growth
Last updated:
apr 23, 2017
Indicators value changes by year
Minimum:
37.809 bln
jan 1, 1991
Maximum:
62.552 bln
jan 1, 2000
At the date of observation
Value
Absolute change
Change from previous value
jan 1, 1986
41.731 bln
+41.731 bln
0.0%
jan 1, 1987
44.042 bln
+2.31 bln
5.54%
jan 1, 1988
44.125 bln
+83.005 mln
0.19%
jan 1, 1989
42.506 bln
-1.619 bln
-3.67%
jan 1, 1990
41.275 bln
-1.231 bln
-2.9%
jan 1, 1991
37.809 bln
-3.466 bln
-8.4%
jan 1, 1992
40.825 bln
+3.016 bln
7.98%
jan 1, 1993
44.082 bln
+3.256 bln
7.98%
jan 1, 1994
46.417 bln
+2.335 bln
5.3%
jan 1, 1995
42.445 bln
-3.972 bln
-8.56%
jan 1, 1996
44.087 bln
+1.643 bln
3.87%
jan 1, 1997
47.471 bln
+3.384 bln
7.68%
jan 1, 1998
51.838 bln
+4.367 bln
9.2%
jan 1, 1999
54.251 bln
+2.413 bln
4.65%
jan 1, 2000
62.552 bln
+8.301 bln
15.3%
jan 1, 2001
53.761 bln
-8.791 bln
-14.05%
jan 1, 2002
57.241 bln
+3.48 bln
6.47%
jan 1, 2003
53.313 bln
-3.928 bln
-6.86%
jan 1, 2004
49.288 bln
-4.025 bln
-7.55%
jan 1, 2005
51.905 bln
+2.617 bln
5.31%
jan 1, 2006
53.397 bln
+1.492 bln
2.88%
jan 1, 2007
46.406 bln
-6.991 bln
-13.09%
jan 1, 2008
43.862 bln
-2.544 bln
-5.48%
jan 1, 2009
47.114 bln
+3.251 bln
7.41%
jan 1, 2010
47.082 bln
-32.242 mln
-0.07%
jan 1, 2011
46.542 bln
-539.417 mln
-1.15%
jan 1, 2012
52.184 bln
+5.642 bln
12.12%
jan 1, 2013
56.722 bln
+4.538 bln
8.7%
jan 1, 2014
61.314 bln
+4.592 bln
8.1%
jan 1, 2015
52.622 bln
-8.692 bln
-14.18%
Ranking of countries by current statistics by years


Comments: