29
/
en
AIzaSyAYiBZKx7MnpbEhh9jyipgxe19OcubqV5w
April 1, 2024
145918
Guinea
GIN
true
2
1
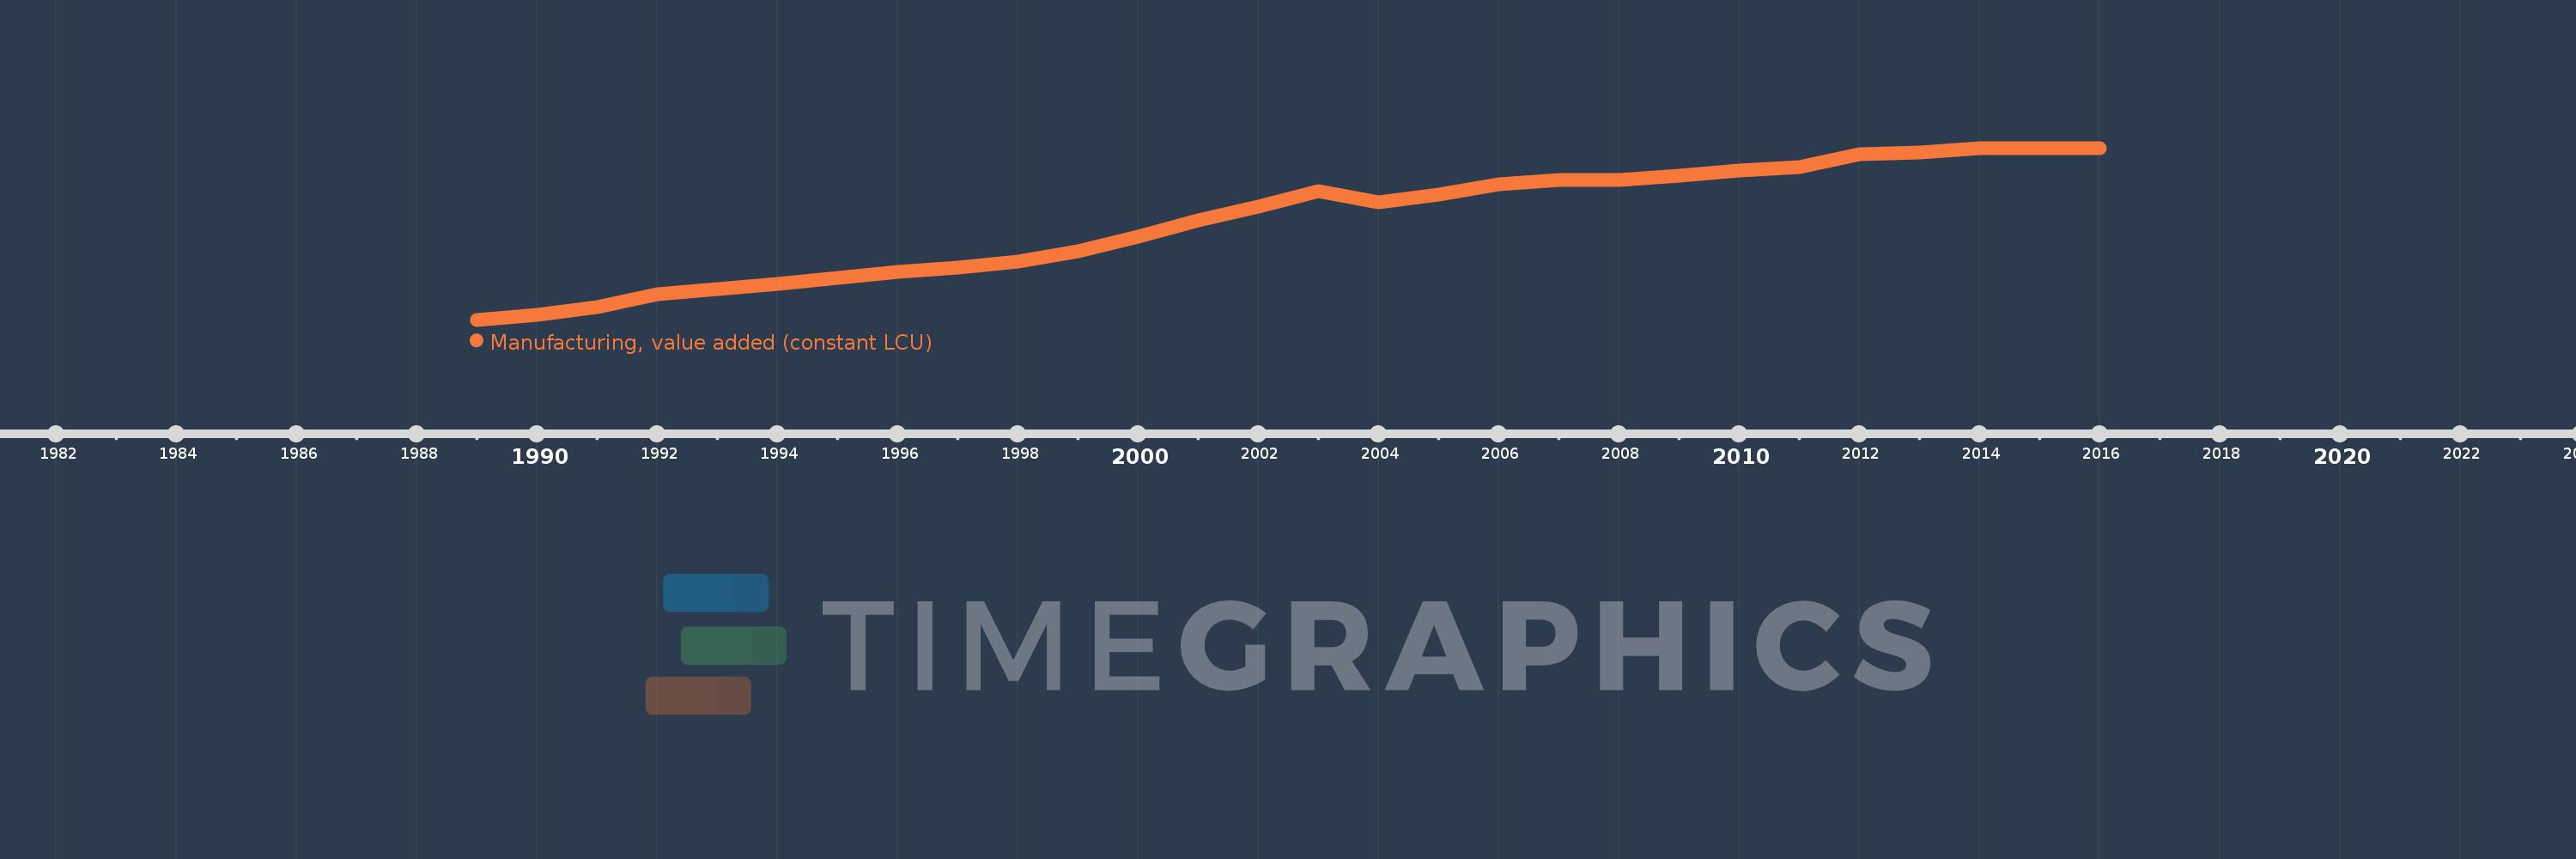
Manufacturing, value added (constant LCU)
2016,2015,2014,2013,2012,2011,2010,2009,2008,2007,2006,2005,2004,2003,2002,2001,2000,1999,1998,1997,1996,1995,1994,1993,1992,1991,1990,1989
This statistics in other country:
AfghanistanAlbaniaAlgeriaAntigua and BarbudaArgentinaArmeniaAustraliaAustriaAzerbaijanBahamas, TheBahrainBangladeshBelarusBelgiumBelizeBeninBermudaBhutanBoliviaBosnia and HerzegovinaBotswanaBrazilBrunei DarussalamBurkina FasoBurundiCabo VerdeCambodiaCameroonCanadaCayman IslandsCentral African RepublicChadChileColombiaComorosCongo, Dem. Rep.Congo, Rep.Costa RicaCote d'IvoireCroatiaCubaCyprusCzech RepublicDenmarkDjiboutiDominicaDominican RepublicEcuadorEgypt, Arab Rep.El SalvadorEquatorial GuineaEritreaEstoniaEthiopiaFijiFinlandFranceGabonGambia, TheGeorgiaGermanyGhanaGreeceGrenadaGuatemalaGuineaGuyanaHaitiHondurasHong Kong SAR, ChinaHungaryIcelandIndiaIndonesiaIran, Islamic Rep.IraqIrelandItalyJamaicaJapanJordanKazakhstanKenyaKiribatiKorea, Rep.KosovoKuwaitKyrgyz RepublicLao PDRLatviaLebanonLesothoLiberiaLibyaLithuaniaLuxembourgMacedonia, FYRMadagascarMalawiMalaysiaMaldivesMarshall IslandsMauritaniaMauritiusMexicoMicronesia, Fed. Sts.MoldovaMongoliaMontenegroMoroccoMozambiqueMyanmarNamibiaNepalNetherlandsNew ZealandNicaraguaNigerNigeriaNorwayOmanPakistanPalauPanamaPapua New GuineaParaguayPeruPhilippinesPolandPortugalPuerto RicoQatarRomaniaRussian FederationRwandaSamoaSao Tome and PrincipeSaudi ArabiaSenegalSerbiaSeychellesSierra LeoneSingaporeSlovak RepublicSloveniaSolomon IslandsSomaliaSouth AfricaSpainSri LankaSt. Kitts and NevisSt. LuciaSt. Vincent and the GrenadinesSudanSurinameSwazilandSwedenSwitzerlandSyrian Arab RepublicTajikistanTanzaniaThailandTimor-LesteTogoTongaTrinidad and TobagoTunisiaTurkeyTuvaluUgandaUkraineUnited Arab EmiratesUnited KingdomUnited StatesUruguayUzbekistanVanuatuVenezuela, RBVietnamWest Bank and GazaZambiaZimbabwe Timeline:
This timeline shows a graph from 1989 to 2016 of Guinea. No data until 1988. Number of actual observations by date: 28.
Source name:
World Development Indicators
Source organization:
World Bank national accounts data, and OECD National Accounts data files.
Categories, topics:
Economy & Growth
Last updated:
apr 23, 2017
Indicators value changes by year
Minimum:
227.219 bln
jan 1, 1989
Maximum:
488.145 bln
jan 1, 2014
At the date of observation
Value
Absolute change
Change from previous value
jan 1, 1989
227.219 bln
+227.219 bln
0.0%
jan 1, 1990
234.171 bln
+6.952 bln
3.06%
jan 1, 1991
245.88 bln
+11.709 bln
5.0%
jan 1, 1992
265.704 bln
+19.824 bln
8.06%
jan 1, 1993
273.143 bln
+7.44 bln
2.8%
jan 1, 1994
281.338 bln
+8.194 bln
3.0%
jan 1, 1995
291.184 bln
+9.847 bln
3.5%
jan 1, 1996
300.502 bln
+9.318 bln
3.2%
jan 1, 1997
305.911 bln
+5.409 bln
1.8%
jan 1, 1998
315.395 bln
+9.483 bln
3.1%
jan 1, 1999
331.795 bln
+16.401 bln
5.2%
jan 1, 2000
353.362 bln
+21.567 bln
6.5%
jan 1, 2001
378.097 bln
+24.735 bln
7.0%
jan 1, 2002
398.892 bln
+20.795 bln
5.5%
jan 1, 2003
422.427 bln
+23.535 bln
5.9%
jan 1, 2004
405.53 bln
-16.897 bln
-4.0%
jan 1, 2005
417.696 bln
+12.166 bln
3.0%
jan 1, 2006
432.315 bln
+14.619 bln
3.5%
jan 1, 2007
440.097 bln
+7.782 bln
1.8%
jan 1, 2008
439.657 bln
-440.097 mln
-0.1%
jan 1, 2009
446.252 bln
+6.595 bln
1.5%
jan 1, 2010
453.392 bln
+7.14 bln
1.6%
jan 1, 2011
458.832 bln
+5.441 bln
1.2%
jan 1, 2012
479.021 bln
+20.189 bln
4.4%
jan 1, 2013
481.13 bln
+2.109 bln
0.44%
jan 1, 2014
488.145 bln
+7.015 bln
1.46%
jan 1, 2015
487.149 bln
-996.0 mln
-0.2%
jan 1, 2016
488.0 bln
+851.0 mln
0.17%
Ranking of countries by current statistics by years


Comments: