29
/
en
AIzaSyAYiBZKx7MnpbEhh9jyipgxe19OcubqV5w
April 1, 2024
84189
Benin
BEN
true
2
1
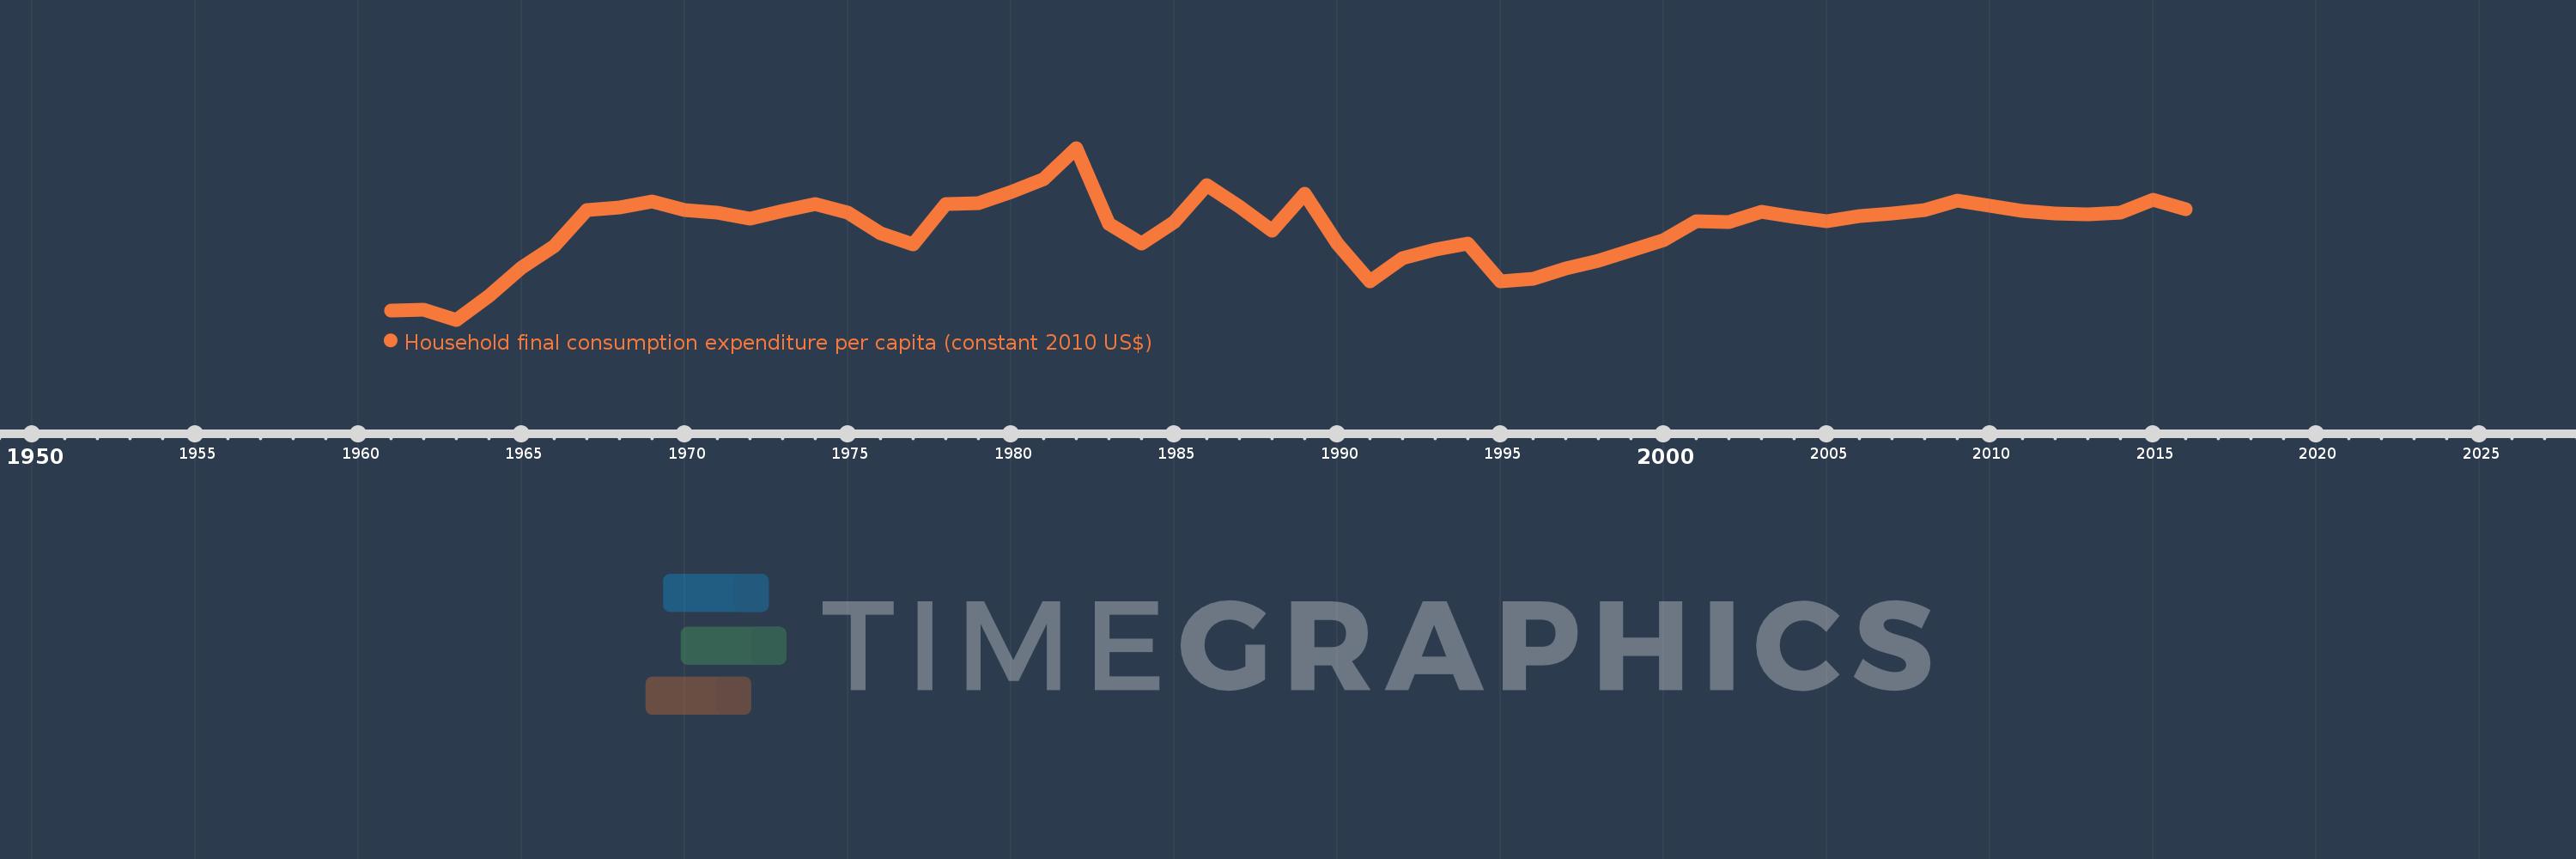
Household final consumption expenditure per capita (constant 2010 US$)
2016,2015,2014,2013,2012,2011,2010,2009,2008,2007,2006,2005,2004,2003,2002,2001,2000,1999,1998,1997,1996,1995,1994,1993,1992,1991,1990,1989,1988,1987,1986,1985,1984,1983,1982,1981,1980,1979,1978,1977,1976,1975,1974,1973,1972,1971,1970,1969,1968,1967,1966,1965,1964,1963,1962,1961
This statistics in other country:
AfghanistanAlbaniaAlgeriaAngolaAntigua and BarbudaArab WorldArgentinaArmeniaArubaAustraliaAustriaAzerbaijanBahamas, TheBahrainBangladeshBarbadosBelarusBelgiumBelizeBeninBermudaBhutanBoliviaBosnia and HerzegovinaBotswanaBrazilBrunei DarussalamBulgariaBurkina FasoBurundiCabo VerdeCambodiaCameroonCanadaCaribbean small statesCentral African RepublicCentral Europe and the BalticsChadChileChinaColombiaComorosCongo, Dem. Rep.Congo, Rep.Costa RicaCote d'IvoireCroatiaCubaCyprusCzech RepublicDenmarkDominicaDominican RepublicEarly-demographic dividendEast Asia & PacificEast Asia & Pacific (excluding high income)East Asia & Pacific (IDA & IBRD countries)EcuadorEgypt, Arab Rep.El SalvadorEquatorial GuineaEritreaEstoniaEuro areaEurope & Central AsiaEurope & Central Asia (excluding high income)Europe & Central Asia (IDA & IBRD countries)European UnionFaroe IslandsFinlandFranceGabonGambia, TheGeorgiaGermanyGhanaGreeceGrenadaGuatemalaGuineaGuinea-BissauGuyanaHaitiHeavily indebted poor countries (HIPC)High incomeHondurasHong Kong SAR, ChinaHungaryIBRD onlyIcelandIDA & IBRD totalIDA blendIDA onlyIDA totalIndiaIndonesiaIran, Islamic Rep.IrelandIsraelItalyJamaicaJapanJordanKazakhstanKenyaKorea, Rep.KosovoKuwaitKyrgyz RepublicLao PDRLate-demographic dividendLatin America & Caribbean Latin America & Caribbean (excluding high income)Latin America & the Caribbean (IDA & IBRD countries)LatviaLeast developed countries: UN classificationLebanonLiberiaLithuaniaLow & middle incomeLow incomeLower middle incomeLuxembourgMacao SAR, ChinaMacedonia, FYRMadagascarMalawiMalaysiaMaliMaltaMauritaniaMauritiusMexicoMiddle East & North AfricaMiddle East & North Africa (excluding high income)Middle East & North Africa (IDA & IBRD countries)Middle incomeMoldovaMongoliaMontenegroMoroccoMozambiqueNamibiaNepalNetherlandsNew ZealandNicaraguaNigerNigeriaNorth AmericaNorwayOECD membersOmanOther small statesPakistanPanamaParaguayPeruPhilippinesPolandPortugalPost-demographic dividendPre-demographic dividendPuerto RicoQatarRomaniaRussian FederationRwandaSaudi ArabiaSenegalSerbiaSeychellesSierra LeoneSingaporeSlovak RepublicSloveniaSmall statesSouth AfricaSouth AsiaSouth Asia (IDA & IBRD)South SudanSpainSri LankaSt. Kitts and NevisSt. LuciaSt. Vincent and the GrenadinesSub-Saharan Africa Sub-Saharan Africa (excluding high income)Sub-Saharan Africa (IDA & IBRD countries)SudanSurinameSwazilandSwedenSwitzerlandTajikistanTanzaniaThailandTimor-LesteTogoTongaTrinidad and TobagoTunisiaTurkeyTurkmenistanUgandaUkraineUnited Arab EmiratesUnited KingdomUnited StatesUpper middle incomeUruguayUzbekistanVanuatuVenezuela, RBVietnamWest Bank and GazaWorldYemen, Rep.ZambiaZimbabwe Timeline:
This timeline shows a graph from 1961 to 2016 of Benin. No data until 1960. Number of actual observations by date: 56.
Source name:
World Development Indicators
Source organization:
World Bank national accounts data, and OECD National Accounts data files.
Categories, topics:
Economy & Growth
Last updated:
apr 23, 2017
Indicators value changes by year
Minimum:
414.334
jan 1, 1963
Maximum:
610.296
jan 1, 1982
At the date of observation
Value
Absolute change
Change from previous value
jan 1, 1961
424.536
+424.536
0.0%
jan 1, 1962
425.561
+1.026
0.24%
jan 1, 1963
414.334
-11.227
-2.64%
jan 1, 1964
441.956
+27.622
6.67%
jan 1, 1965
473.381
+31.425
7.11%
jan 1, 1966
498.667
+25.286
5.34%
jan 1, 1967
539.429
+40.762
8.17%
jan 1, 1968
541.941
+2.512
0.47%
jan 1, 1969
549.591
+7.65
1.41%
jan 1, 1970
539.648
-9.943
-1.81%
jan 1, 1971
536.463
-3.185
-0.59%
jan 1, 1972
529.845
-6.618
-1.23%
jan 1, 1973
538.378
+8.532
1.61%
jan 1, 1974
546.337
+7.959
1.48%
jan 1, 1975
536.57
-9.767
-1.79%
jan 1, 1976
513.284
-23.286
-4.34%
jan 1, 1977
500.085
-13.199
-2.57%
jan 1, 1978
546.632
+46.548
9.31%
jan 1, 1979
546.991
+0.358
0.07%
jan 1, 1980
560.399
+13.409
2.45%
jan 1, 1981
574.97
+14.571
2.6%
jan 1, 1982
610.296
+35.325
6.14%
jan 1, 1983
524.131
-86.165
-14.12%
jan 1, 1984
500.815
-23.316
-4.45%
jan 1, 1985
526.115
+25.299
5.05%
jan 1, 1986
568.33
+42.215
8.02%
jan 1, 1987
543.094
-25.236
-4.44%
jan 1, 1988
516.255
-26.839
-4.94%
jan 1, 1989
558.204
+41.949
8.13%
jan 1, 1990
501.345
-56.859
-10.19%
jan 1, 1991
458.486
-42.86
-8.55%
jan 1, 1992
484.422
+25.936
5.66%
jan 1, 1993
493.997
+9.574
1.98%
jan 1, 1994
501.105
+7.108
1.44%
jan 1, 1995
457.723
-43.382
-8.66%
jan 1, 1996
461.225
+3.502
0.77%
jan 1, 1997
472.604
+11.379
2.47%
jan 1, 1998
481.892
+9.289
1.97%
jan 1, 1999
493.78
+11.887
2.47%
jan 1, 2000
505.07
+11.29
2.29%
jan 1, 2001
526.624
+21.555
4.27%
jan 1, 2002
525.921
-0.703
-0.13%
jan 1, 2003
537.889
+11.968
2.28%
jan 1, 2004
531.171
-6.718
-1.25%
jan 1, 2005
527.033
-4.137
-0.78%
jan 1, 2006
532.392
+5.358
1.02%
jan 1, 2007
535.188
+2.797
0.53%
jan 1, 2008
538.977
+3.789
0.71%
jan 1, 2009
550.053
+11.076
2.06%
jan 1, 2010
544.123
-5.931
-1.08%
jan 1, 2011
538.24
-5.883
-1.08%
jan 1, 2012
535.686
-2.553
-0.47%
jan 1, 2013
534.567
-1.119
-0.21%
jan 1, 2014
536.846
+2.279
0.43%
jan 1, 2015
551.233
+14.387
2.68%
jan 1, 2016
540.652
-10.581
-1.92%
Ranking of countries by current statistics by years


Comments: