29
/
en
AIzaSyAYiBZKx7MnpbEhh9jyipgxe19OcubqV5w
April 1, 2024
111032
Congo, Rep.
COG
true
2
1
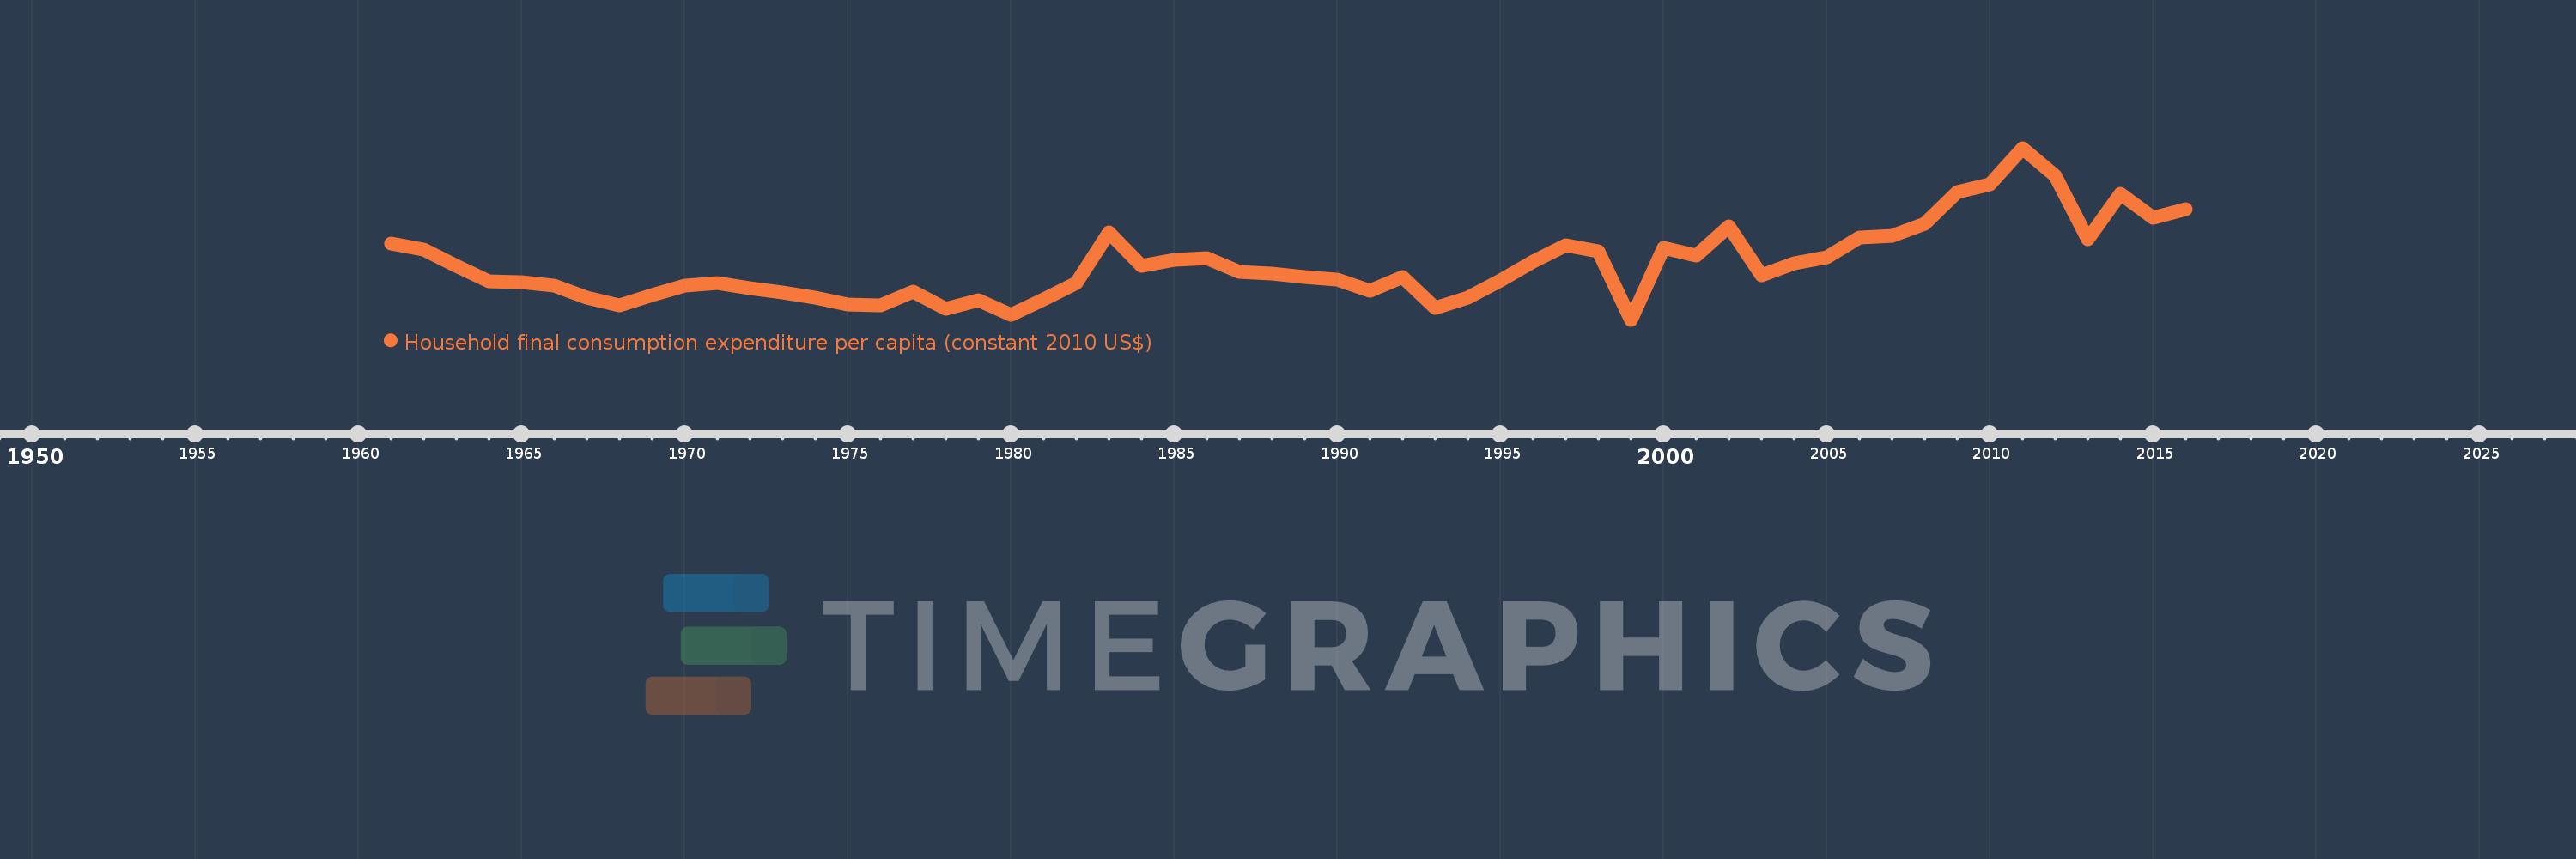
Household final consumption expenditure per capita (constant 2010 US$)
2016,2015,2014,2013,2012,2011,2010,2009,2008,2007,2006,2005,2004,2003,2002,2001,2000,1999,1998,1997,1996,1995,1994,1993,1992,1991,1990,1989,1988,1987,1986,1985,1984,1983,1982,1981,1980,1979,1978,1977,1976,1975,1974,1973,1972,1971,1970,1969,1968,1967,1966,1965,1964,1963,1962,1961
This statistics in other country:
AfghanistanAlbaniaAlgeriaAngolaAntigua and BarbudaArab WorldArgentinaArmeniaArubaAustraliaAustriaAzerbaijanBahamas, TheBahrainBangladeshBarbadosBelarusBelgiumBelizeBeninBermudaBhutanBoliviaBosnia and HerzegovinaBotswanaBrazilBrunei DarussalamBulgariaBurkina FasoBurundiCabo VerdeCambodiaCameroonCanadaCaribbean small statesCentral African RepublicCentral Europe and the BalticsChadChileChinaColombiaComorosCongo, Dem. Rep.Congo, Rep.Costa RicaCote d'IvoireCroatiaCubaCyprusCzech RepublicDenmarkDominicaDominican RepublicEarly-demographic dividendEast Asia & PacificEast Asia & Pacific (excluding high income)East Asia & Pacific (IDA & IBRD countries)EcuadorEgypt, Arab Rep.El SalvadorEquatorial GuineaEritreaEstoniaEuro areaEurope & Central AsiaEurope & Central Asia (excluding high income)Europe & Central Asia (IDA & IBRD countries)European UnionFaroe IslandsFinlandFranceGabonGambia, TheGeorgiaGermanyGhanaGreeceGrenadaGuatemalaGuineaGuinea-BissauGuyanaHaitiHeavily indebted poor countries (HIPC)High incomeHondurasHong Kong SAR, ChinaHungaryIBRD onlyIcelandIDA & IBRD totalIDA blendIDA onlyIDA totalIndiaIndonesiaIran, Islamic Rep.IrelandIsraelItalyJamaicaJapanJordanKazakhstanKenyaKorea, Rep.KosovoKuwaitKyrgyz RepublicLao PDRLate-demographic dividendLatin America & Caribbean Latin America & Caribbean (excluding high income)Latin America & the Caribbean (IDA & IBRD countries)LatviaLeast developed countries: UN classificationLebanonLiberiaLithuaniaLow & middle incomeLow incomeLower middle incomeLuxembourgMacao SAR, ChinaMacedonia, FYRMadagascarMalawiMalaysiaMaliMaltaMauritaniaMauritiusMexicoMiddle East & North AfricaMiddle East & North Africa (excluding high income)Middle East & North Africa (IDA & IBRD countries)Middle incomeMoldovaMongoliaMontenegroMoroccoMozambiqueNamibiaNepalNetherlandsNew ZealandNicaraguaNigerNigeriaNorth AmericaNorwayOECD membersOmanOther small statesPakistanPanamaParaguayPeruPhilippinesPolandPortugalPost-demographic dividendPre-demographic dividendPuerto RicoQatarRomaniaRussian FederationRwandaSaudi ArabiaSenegalSerbiaSeychellesSierra LeoneSingaporeSlovak RepublicSloveniaSmall statesSouth AfricaSouth AsiaSouth Asia (IDA & IBRD)South SudanSpainSri LankaSt. Kitts and NevisSt. LuciaSt. Vincent and the GrenadinesSub-Saharan Africa Sub-Saharan Africa (excluding high income)Sub-Saharan Africa (IDA & IBRD countries)SudanSurinameSwazilandSwedenSwitzerlandTajikistanTanzaniaThailandTimor-LesteTogoTongaTrinidad and TobagoTunisiaTurkeyTurkmenistanUgandaUkraineUnited Arab EmiratesUnited KingdomUnited StatesUpper middle incomeUruguayUzbekistanVanuatuVenezuela, RBVietnamWest Bank and GazaWorldYemen, Rep.ZambiaZimbabwe Timeline:
This timeline shows a graph from 1961 to 2016 of Congo, Rep.. No data until 1960. Number of actual observations by date: 56.
Source name:
World Development Indicators
Source organization:
World Bank national accounts data, and OECD National Accounts data files.
Categories, topics:
Economy & Growth
Last updated:
apr 23, 2017
Indicators value changes by year
Minimum:
369.573
jan 1, 1999
At the date of observation
Value
Absolute change
Change from previous value
jan 1, 1961
709.773
+709.773
0.0%
jan 1, 1962
684.76
-25.013
-3.52%
jan 1, 1963
610.732
-74.028
-10.81%
jan 1, 1964
541.488
-69.244
-11.34%
jan 1, 1965
536.721
-4.767
-0.88%
jan 1, 1966
523.784
-12.937
-2.41%
jan 1, 1967
467.553
-56.23
-10.74%
jan 1, 1968
434.621
-32.932
-7.04%
jan 1, 1969
479.345
+44.723
10.29%
jan 1, 1970
522.719
+43.375
9.05%
jan 1, 1971
533.938
+11.219
2.15%
jan 1, 1972
511.794
-22.144
-4.15%
jan 1, 1973
492.176
-19.617
-3.83%
jan 1, 1974
468.218
-23.958
-4.87%
jan 1, 1975
438.3
-29.918
-6.39%
jan 1, 1976
432.078
-6.221
-1.42%
jan 1, 1977
495.27
+63.191
14.62%
jan 1, 1978
419.02
-76.25
-15.4%
jan 1, 1979
458.411
+39.391
9.4%
jan 1, 1980
393.447
-64.964
-14.17%
jan 1, 1981
459.114
+65.667
16.69%
jan 1, 1982
532.562
+73.448
16.0%
jan 1, 1983
761.196
+228.634
42.93%
jan 1, 1984
613.08
-148.117
-19.46%
jan 1, 1985
638.418
+25.338
4.13%
jan 1, 1986
644.165
+5.747
0.9%
jan 1, 1987
583.827
-60.338
-9.37%
jan 1, 1988
575.574
-8.253
-1.41%
jan 1, 1989
562.199
-13.374
-2.32%
jan 1, 1990
549.586
-12.614
-2.24%
jan 1, 1991
499.48
-50.106
-9.12%
jan 1, 1992
561.287
+61.807
12.37%
jan 1, 1993
423.676
-137.611
-24.52%
jan 1, 1994
469.936
+46.26
10.92%
jan 1, 1995
546.039
+76.103
16.19%
jan 1, 1996
631.66
+85.621
15.68%
jan 1, 1997
702.763
+71.102
11.26%
jan 1, 1998
675.817
-26.946
-3.83%
jan 1, 1999
369.573
-306.244
-45.31%
jan 1, 2000
692.946
+323.374
87.5%
jan 1, 2001
658.645
-34.302
-4.95%
jan 1, 2002
788.09
+129.446
19.65%
jan 1, 2003
569.557
-218.533
-27.73%
jan 1, 2004
621.255
+51.698
9.08%
jan 1, 2005
651.556
+30.302
4.88%
jan 1, 2006
736.718
+85.162
13.07%
jan 1, 2007
747.435
+10.718
1.45%
jan 1, 2008
798.801
+51.365
6.87%
jan 1, 2009
943.82
+145.02
18.15%
jan 1, 2010
976.235
+32.414
3.43%
jan 1, 2011
1.14K
+164.136
16.81%
jan 1, 2012
1.018K
-122.757
-10.76%
jan 1, 2013
731.34
-286.273
-28.13%
jan 1, 2014
933.659
+202.319
27.66%
jan 1, 2015
827.573
-106.086
-11.36%
jan 1, 2016
866.611
+39.038
4.72%
Ranking of countries by current statistics by years


Comments: