29
/
en
AIzaSyAYiBZKx7MnpbEhh9jyipgxe19OcubqV5w
April 1, 2024
203020
Mozambique
MOZ
true
2
1
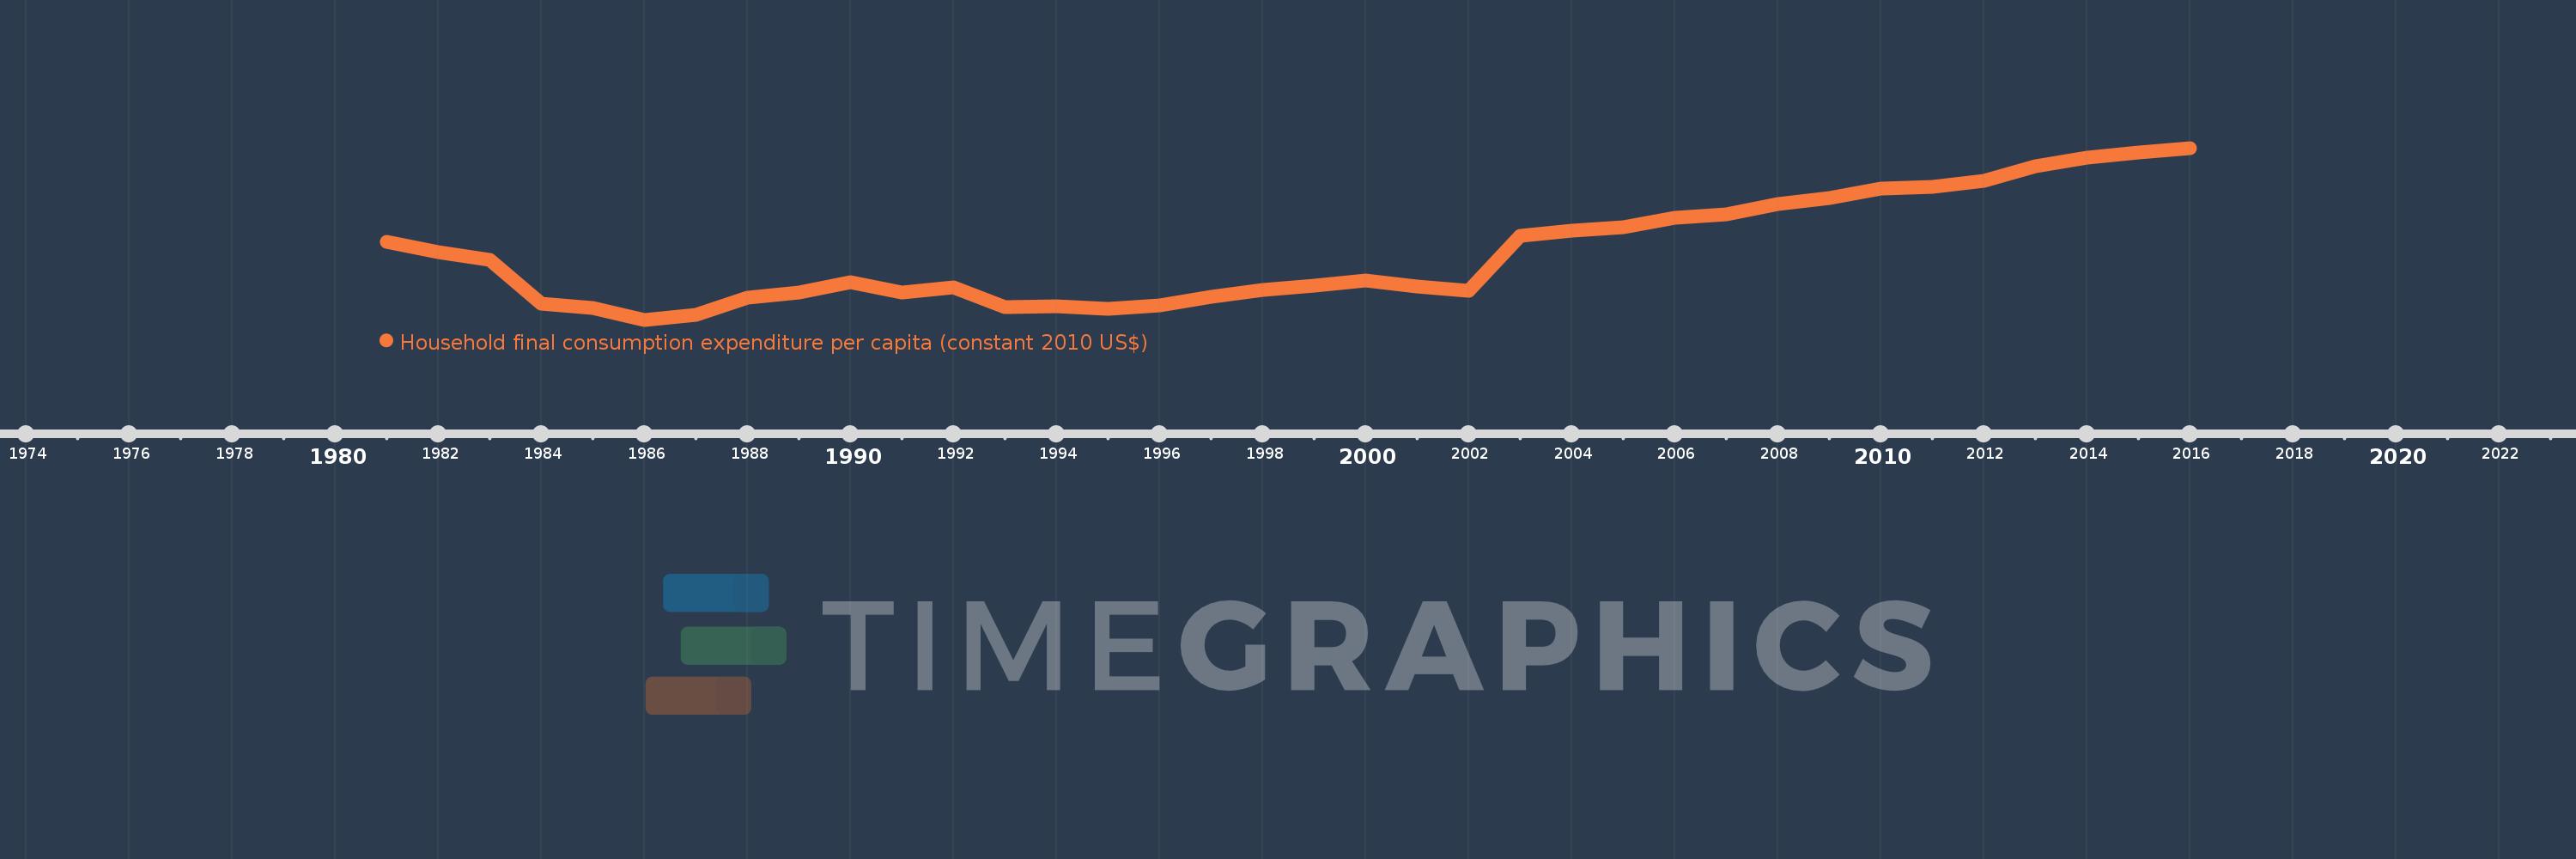
Household final consumption expenditure per capita (constant 2010 US$)
2016,2015,2014,2013,2012,2011,2010,2009,2008,2007,2006,2005,2004,2003,2002,2001,2000,1999,1998,1997,1996,1995,1994,1993,1992,1991,1990,1989,1988,1987,1986,1985,1984,1983,1982,1981
This statistics in other country:
AfghanistanAlbaniaAlgeriaAngolaAntigua and BarbudaArab WorldArgentinaArmeniaArubaAustraliaAustriaAzerbaijanBahamas, TheBahrainBangladeshBarbadosBelarusBelgiumBelizeBeninBermudaBhutanBoliviaBosnia and HerzegovinaBotswanaBrazilBrunei DarussalamBulgariaBurkina FasoBurundiCabo VerdeCambodiaCameroonCanadaCaribbean small statesCentral African RepublicCentral Europe and the BalticsChadChileChinaColombiaComorosCongo, Dem. Rep.Congo, Rep.Costa RicaCote d'IvoireCroatiaCubaCyprusCzech RepublicDenmarkDominicaDominican RepublicEarly-demographic dividendEast Asia & PacificEast Asia & Pacific (excluding high income)East Asia & Pacific (IDA & IBRD countries)EcuadorEgypt, Arab Rep.El SalvadorEquatorial GuineaEritreaEstoniaEuro areaEurope & Central AsiaEurope & Central Asia (excluding high income)Europe & Central Asia (IDA & IBRD countries)European UnionFaroe IslandsFinlandFranceGabonGambia, TheGeorgiaGermanyGhanaGreeceGrenadaGuatemalaGuineaGuinea-BissauGuyanaHaitiHeavily indebted poor countries (HIPC)High incomeHondurasHong Kong SAR, ChinaHungaryIBRD onlyIcelandIDA & IBRD totalIDA blendIDA onlyIDA totalIndiaIndonesiaIran, Islamic Rep.IrelandIsraelItalyJamaicaJapanJordanKazakhstanKenyaKorea, Rep.KosovoKuwaitKyrgyz RepublicLao PDRLate-demographic dividendLatin America & Caribbean Latin America & Caribbean (excluding high income)Latin America & the Caribbean (IDA & IBRD countries)LatviaLeast developed countries: UN classificationLebanonLiberiaLithuaniaLow & middle incomeLow incomeLower middle incomeLuxembourgMacao SAR, ChinaMacedonia, FYRMadagascarMalawiMalaysiaMaliMaltaMauritaniaMauritiusMexicoMiddle East & North AfricaMiddle East & North Africa (excluding high income)Middle East & North Africa (IDA & IBRD countries)Middle incomeMoldovaMongoliaMontenegroMoroccoMozambiqueNamibiaNepalNetherlandsNew ZealandNicaraguaNigerNigeriaNorth AmericaNorwayOECD membersOmanOther small statesPakistanPanamaParaguayPeruPhilippinesPolandPortugalPost-demographic dividendPre-demographic dividendPuerto RicoQatarRomaniaRussian FederationRwandaSaudi ArabiaSenegalSerbiaSeychellesSierra LeoneSingaporeSlovak RepublicSloveniaSmall statesSouth AfricaSouth AsiaSouth Asia (IDA & IBRD)South SudanSpainSri LankaSt. Kitts and NevisSt. LuciaSt. Vincent and the GrenadinesSub-Saharan Africa Sub-Saharan Africa (excluding high income)Sub-Saharan Africa (IDA & IBRD countries)SudanSurinameSwazilandSwedenSwitzerlandTajikistanTanzaniaThailandTimor-LesteTogoTongaTrinidad and TobagoTunisiaTurkeyTurkmenistanUgandaUkraineUnited Arab EmiratesUnited KingdomUnited StatesUpper middle incomeUruguayUzbekistanVanuatuVenezuela, RBVietnamWest Bank and GazaWorldYemen, Rep.ZambiaZimbabwe Timeline:
This timeline shows a graph from 1981 to 2016 of Mozambique. No data until 1980. Number of actual observations by date: 36.
Source name:
World Development Indicators
Source organization:
World Bank national accounts data, and OECD National Accounts data files.
Categories, topics:
Economy & Growth
Last updated:
apr 23, 2017
Indicators value changes by year
Minimum:
170.853
jan 1, 1986
Maximum:
370.108
jan 1, 2016
At the date of observation
Value
Absolute change
Change from previous value
jan 1, 1981
260.845
+260.845
0.0%
jan 1, 1982
248.932
-11.913
-4.57%
jan 1, 1983
240.173
-8.759
-3.52%
jan 1, 1984
189.95
-50.223
-20.91%
jan 1, 1985
184.233
-5.717
-3.01%
jan 1, 1986
170.853
-13.38
-7.26%
jan 1, 1987
176.544
+5.691
3.33%
jan 1, 1988
196.054
+19.51
11.05%
jan 1, 1989
202.195
+6.141
3.13%
jan 1, 1990
214.396
+12.201
6.03%
jan 1, 1991
202.91
-11.487
-5.36%
jan 1, 1992
208.903
+5.993
2.95%
jan 1, 1993
185.181
-23.722
-11.36%
jan 1, 1994
186.055
+0.874
0.47%
jan 1, 1995
183.783
-2.272
-1.22%
jan 1, 1996
187.552
+3.769
2.05%
jan 1, 1997
197.391
+9.839
5.25%
jan 1, 1998
205.574
+8.183
4.15%
jan 1, 1999
210.62
+5.046
2.45%
jan 1, 2000
216.386
+5.766
2.74%
jan 1, 2001
209.023
-7.363
-3.4%
jan 1, 2002
204.675
-4.348
-2.08%
jan 1, 2003
268.077
+63.402
30.98%
jan 1, 2004
274.436
+6.359
2.37%
jan 1, 2005
277.857
+3.421
1.25%
jan 1, 2006
288.74
+10.883
3.92%
jan 1, 2007
293.238
+4.498
1.56%
jan 1, 2008
304.617
+11.379
3.88%
jan 1, 2009
312.369
+7.752
2.54%
jan 1, 2010
322.494
+10.125
3.24%
jan 1, 2011
324.892
+2.398
0.74%
jan 1, 2012
331.484
+6.591
2.03%
jan 1, 2013
348.544
+17.06
5.15%
jan 1, 2014
358.831
+10.288
2.95%
jan 1, 2015
365.309
+6.478
1.81%
jan 1, 2016
370.108
+4.798
1.31%
Ranking of countries by current statistics by years


Comments: