29
/
en
AIzaSyAYiBZKx7MnpbEhh9jyipgxe19OcubqV5w
April 1, 2024
190335
Mali
MLI
true
2
1
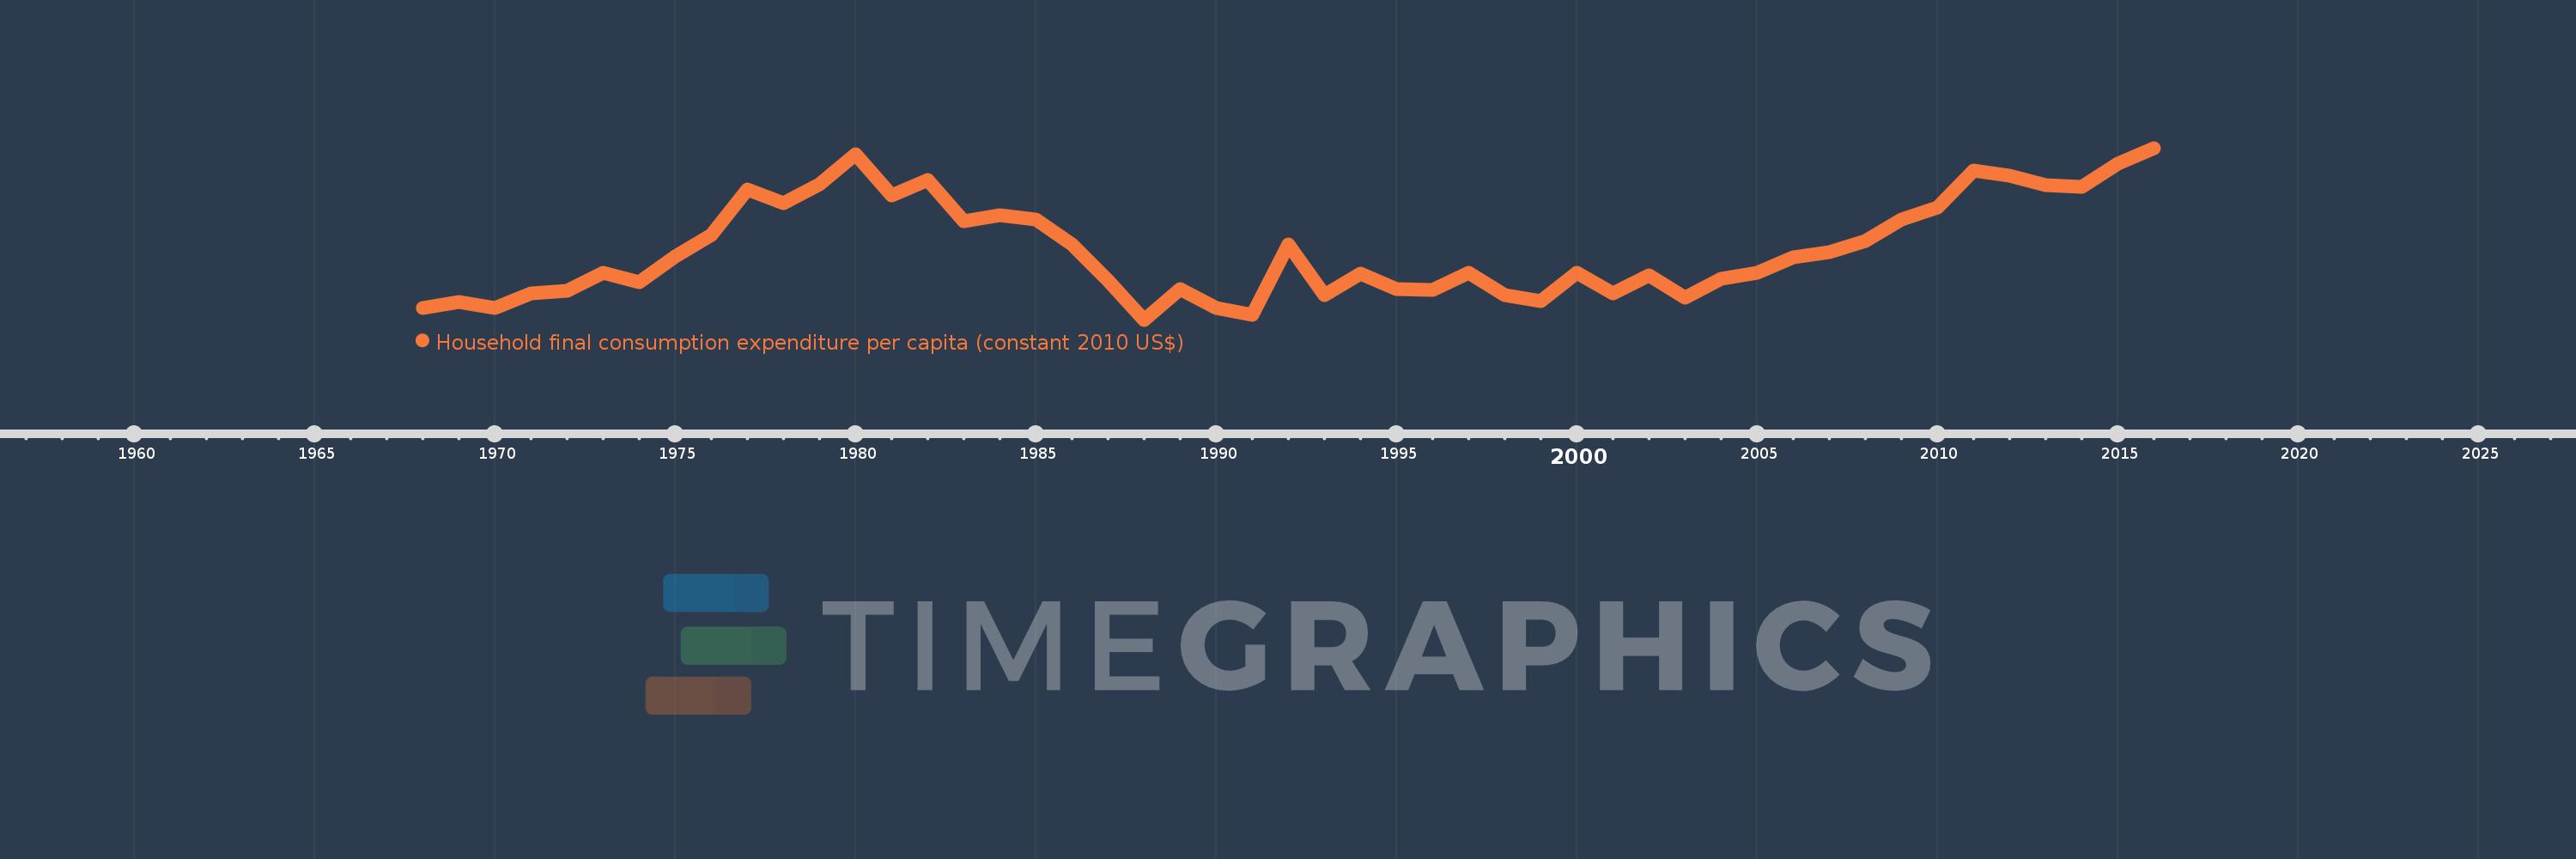
Household final consumption expenditure per capita (constant 2010 US$)
2016,2015,2014,2013,2012,2011,2010,2009,2008,2007,2006,2005,2004,2003,2002,2001,2000,1999,1998,1997,1996,1995,1994,1993,1992,1991,1990,1989,1988,1987,1986,1985,1984,1983,1982,1981,1980,1979,1978,1977,1976,1975,1974,1973,1972,1971,1970,1969,1968
This statistics in other country:
AfghanistanAlbaniaAlgeriaAngolaAntigua and BarbudaArab WorldArgentinaArmeniaArubaAustraliaAustriaAzerbaijanBahamas, TheBahrainBangladeshBarbadosBelarusBelgiumBelizeBeninBermudaBhutanBoliviaBosnia and HerzegovinaBotswanaBrazilBrunei DarussalamBulgariaBurkina FasoBurundiCabo VerdeCambodiaCameroonCanadaCaribbean small statesCentral African RepublicCentral Europe and the BalticsChadChileChinaColombiaComorosCongo, Dem. Rep.Congo, Rep.Costa RicaCote d'IvoireCroatiaCubaCyprusCzech RepublicDenmarkDominicaDominican RepublicEarly-demographic dividendEast Asia & PacificEast Asia & Pacific (excluding high income)East Asia & Pacific (IDA & IBRD countries)EcuadorEgypt, Arab Rep.El SalvadorEquatorial GuineaEritreaEstoniaEuro areaEurope & Central AsiaEurope & Central Asia (excluding high income)Europe & Central Asia (IDA & IBRD countries)European UnionFaroe IslandsFinlandFranceGabonGambia, TheGeorgiaGermanyGhanaGreeceGrenadaGuatemalaGuineaGuinea-BissauGuyanaHaitiHeavily indebted poor countries (HIPC)High incomeHondurasHong Kong SAR, ChinaHungaryIBRD onlyIcelandIDA & IBRD totalIDA blendIDA onlyIDA totalIndiaIndonesiaIran, Islamic Rep.IrelandIsraelItalyJamaicaJapanJordanKazakhstanKenyaKorea, Rep.KosovoKuwaitKyrgyz RepublicLao PDRLate-demographic dividendLatin America & Caribbean Latin America & Caribbean (excluding high income)Latin America & the Caribbean (IDA & IBRD countries)LatviaLeast developed countries: UN classificationLebanonLiberiaLithuaniaLow & middle incomeLow incomeLower middle incomeLuxembourgMacao SAR, ChinaMacedonia, FYRMadagascarMalawiMalaysiaMaliMaltaMauritaniaMauritiusMexicoMiddle East & North AfricaMiddle East & North Africa (excluding high income)Middle East & North Africa (IDA & IBRD countries)Middle incomeMoldovaMongoliaMontenegroMoroccoMozambiqueNamibiaNepalNetherlandsNew ZealandNicaraguaNigerNigeriaNorth AmericaNorwayOECD membersOmanOther small statesPakistanPanamaParaguayPeruPhilippinesPolandPortugalPost-demographic dividendPre-demographic dividendPuerto RicoQatarRomaniaRussian FederationRwandaSaudi ArabiaSenegalSerbiaSeychellesSierra LeoneSingaporeSlovak RepublicSloveniaSmall statesSouth AfricaSouth AsiaSouth Asia (IDA & IBRD)South SudanSpainSri LankaSt. Kitts and NevisSt. LuciaSt. Vincent and the GrenadinesSub-Saharan Africa Sub-Saharan Africa (excluding high income)Sub-Saharan Africa (IDA & IBRD countries)SudanSurinameSwazilandSwedenSwitzerlandTajikistanTanzaniaThailandTimor-LesteTogoTongaTrinidad and TobagoTunisiaTurkeyTurkmenistanUgandaUkraineUnited Arab EmiratesUnited KingdomUnited StatesUpper middle incomeUruguayUzbekistanVanuatuVenezuela, RBVietnamWest Bank and GazaWorldYemen, Rep.ZambiaZimbabwe Timeline:
This timeline shows a graph from 1968 to 2016 of Mali. No data until 1967. Number of actual observations by date: 49.
Source name:
World Development Indicators
Source organization:
World Bank national accounts data, and OECD National Accounts data files.
Categories, topics:
Economy & Growth
Last updated:
apr 23, 2017
Indicators value changes by year
Minimum:
372.922
jan 1, 1988
Maximum:
532.137
jan 1, 2016
At the date of observation
Value
Absolute change
Change from previous value
jan 1, 1968
383.998
+383.998
0.0%
jan 1, 1969
389.277
+5.279
1.37%
jan 1, 1970
383.801
-5.477
-1.41%
jan 1, 1971
397.437
+13.636
3.55%
jan 1, 1972
399.688
+2.251
0.57%
jan 1, 1973
416.401
+16.713
4.18%
jan 1, 1974
407.547
-8.854
-2.13%
jan 1, 1975
431.318
+23.77
5.83%
jan 1, 1976
451.496
+20.178
4.68%
jan 1, 1977
493.416
+41.92
9.28%
jan 1, 1978
481.134
-12.282
-2.49%
jan 1, 1979
498.652
+17.518
3.64%
jan 1, 1980
526.458
+27.806
5.58%
jan 1, 1981
488.006
-38.453
-7.3%
jan 1, 1982
502.507
+14.502
2.97%
jan 1, 1983
463.861
-38.647
-7.69%
jan 1, 1984
469.622
+5.761
1.24%
jan 1, 1985
466.057
-3.565
-0.76%
jan 1, 1986
442.48
-23.577
-5.06%
jan 1, 1987
409.252
-33.229
-7.51%
jan 1, 1988
372.922
-36.33
-8.88%
jan 1, 1989
401.046
+28.125
7.54%
jan 1, 1990
383.533
-17.513
-4.37%
jan 1, 1991
377.276
-6.257
-1.63%
jan 1, 1992
442.451
+65.175
17.28%
jan 1, 1993
396.042
-46.41
-10.49%
jan 1, 1994
415.928
+19.886
5.02%
jan 1, 1995
400.964
-14.964
-3.6%
jan 1, 1996
400.669
-0.295
-0.07%
jan 1, 1997
416.098
+15.429
3.85%
jan 1, 1998
395.934
-20.165
-4.85%
jan 1, 1999
390.33
-5.603
-1.42%
jan 1, 2000
416.29
+25.96
6.65%
jan 1, 2001
397.714
-18.576
-4.46%
jan 1, 2002
414.034
+16.321
4.1%
jan 1, 2003
393.232
-20.802
-5.02%
jan 1, 2004
411.135
+17.903
4.55%
jan 1, 2005
416.322
+5.187
1.26%
jan 1, 2006
430.467
+14.146
3.4%
jan 1, 2007
435.639
+5.172
1.2%
jan 1, 2008
446.102
+10.463
2.4%
jan 1, 2009
466.173
+20.071
4.5%
jan 1, 2010
476.957
+10.784
2.31%
jan 1, 2011
511.134
+34.177
7.17%
jan 1, 2012
506.619
-4.515
-0.88%
jan 1, 2013
497.55
-9.069
-1.79%
jan 1, 2014
495.95
-1.6
-0.32%
jan 1, 2015
517.911
+21.961
4.43%
jan 1, 2016
532.137
+14.225
2.75%
Ranking of countries by current statistics by years


Comments: