29
/
en
AIzaSyAYiBZKx7MnpbEhh9jyipgxe19OcubqV5w
April 1, 2024
81073
Belarus
BLR
true
2
1
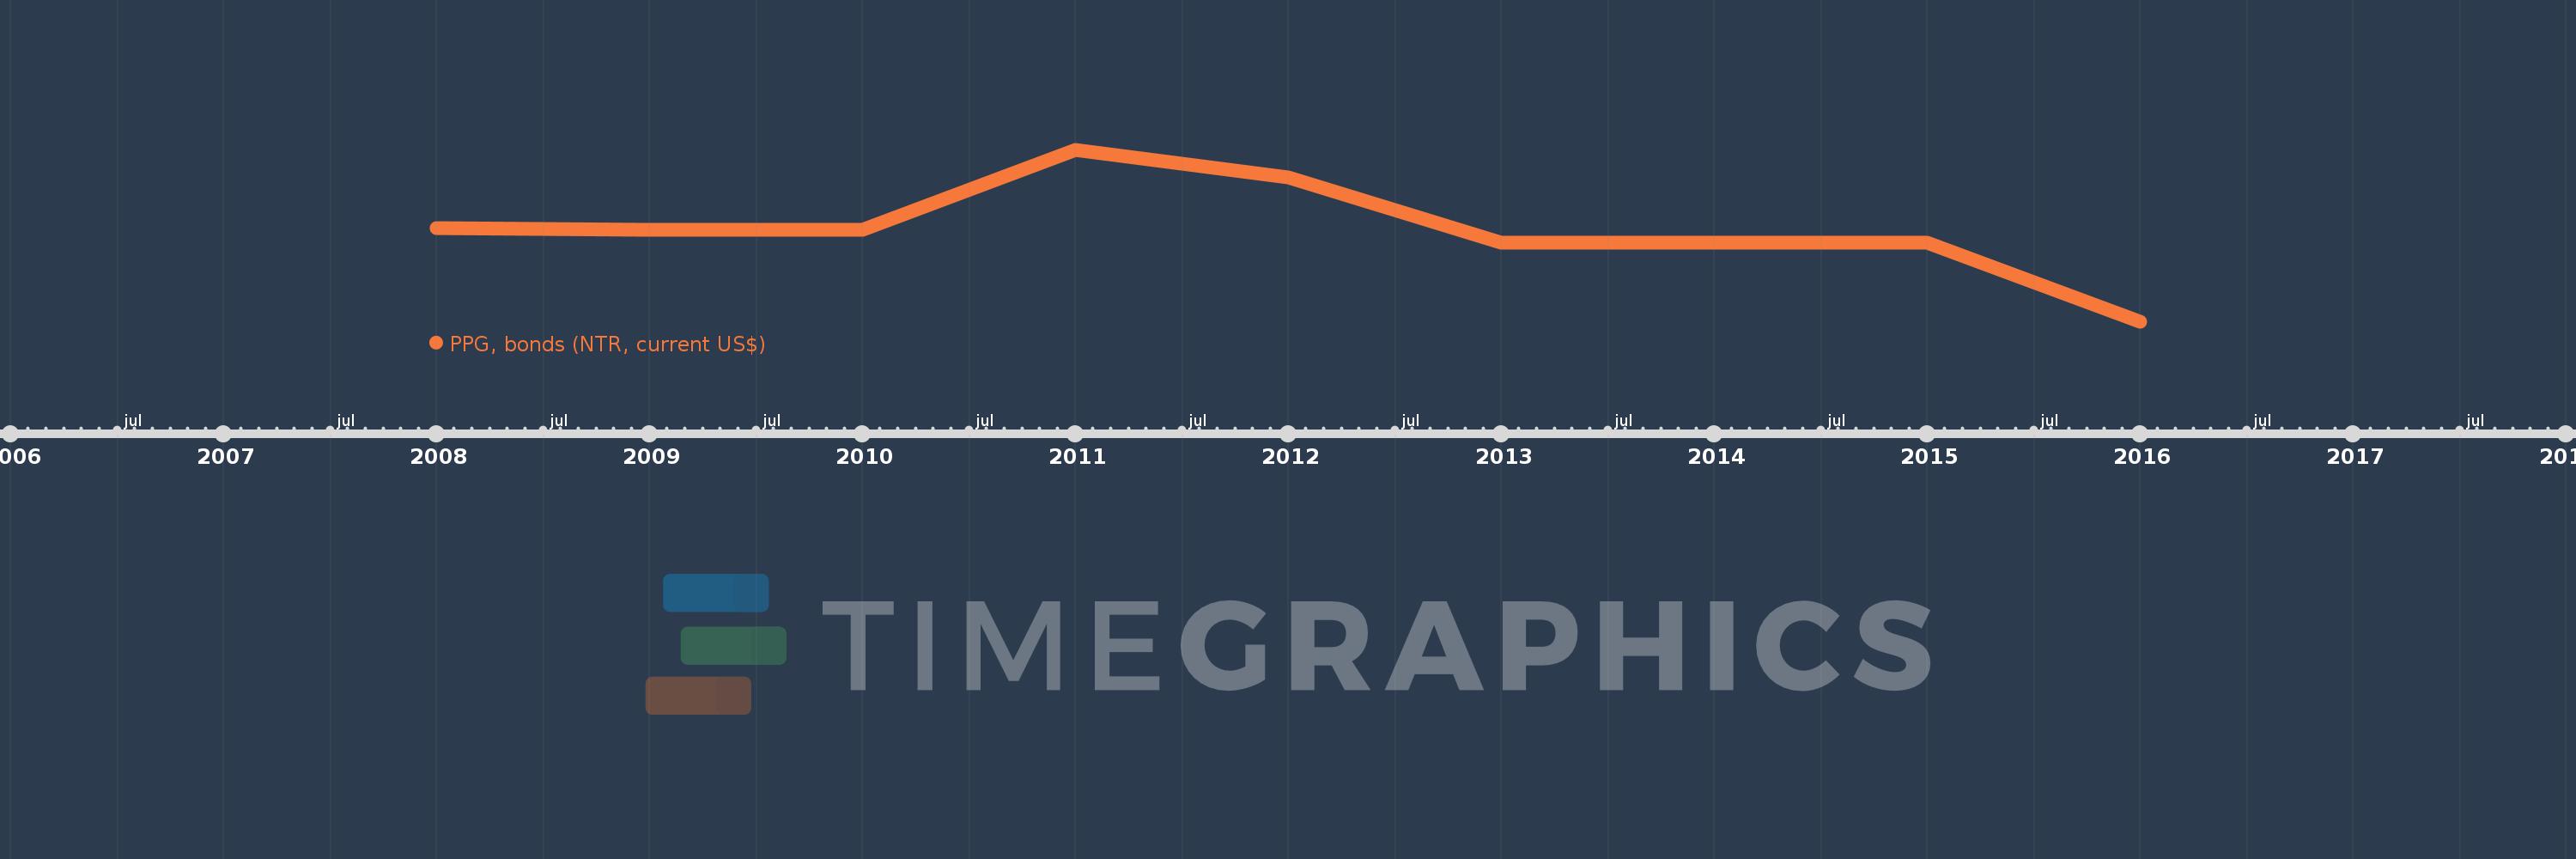
PPG, bonds (NTR, current US$)
2016,2015,2014,2013,2012,2011,2010,2009,2008
This statistics in other country:
Timeline:
This timeline shows a graph from 2008 to 2016 of Belarus. No data until 2007. Number of actual observations by date: 9.
Source name:
World Development Indicators
Source organization:
World Bank, International Debt Statistics.
Categories, topics:
External Debt
Last updated:
apr 23, 2017
Indicators value changes by year
Minimum:
-1.158 bln
jan 1, 2016
Maximum:
995.582 mln
jan 1, 2011
At the date of observation
Value
Absolute change
Change from previous value
jan 1, 2008
18.621 mln
+18.621 mln
0.0%
jan 1, 2009
-1.237 mln
-19.858 mln
-106.64%
jan 1, 2010
-2.474 mln
-1.237 mln
100.0%
jan 1, 2011
995.582 mln
+998.056 mln
-40.34K%
jan 1, 2012
651.915 mln
-343.667 mln
-34.52%
jan 1, 2013
-159.1 mln
-811.015 mln
-124.41%
jan 1, 2014
-159.1 mln
0.0
0.0%
jan 1, 2015
-159.102 mln
-2.0K
0.0%
jan 1, 2016
-1.158 bln
-999.0 mln
627.9%
Ranking of countries by current statistics by years


Comments: