29
/
en
AIzaSyAYiBZKx7MnpbEhh9jyipgxe19OcubqV5w
April 1, 2024
272786
Uganda
UGA
true
2
1
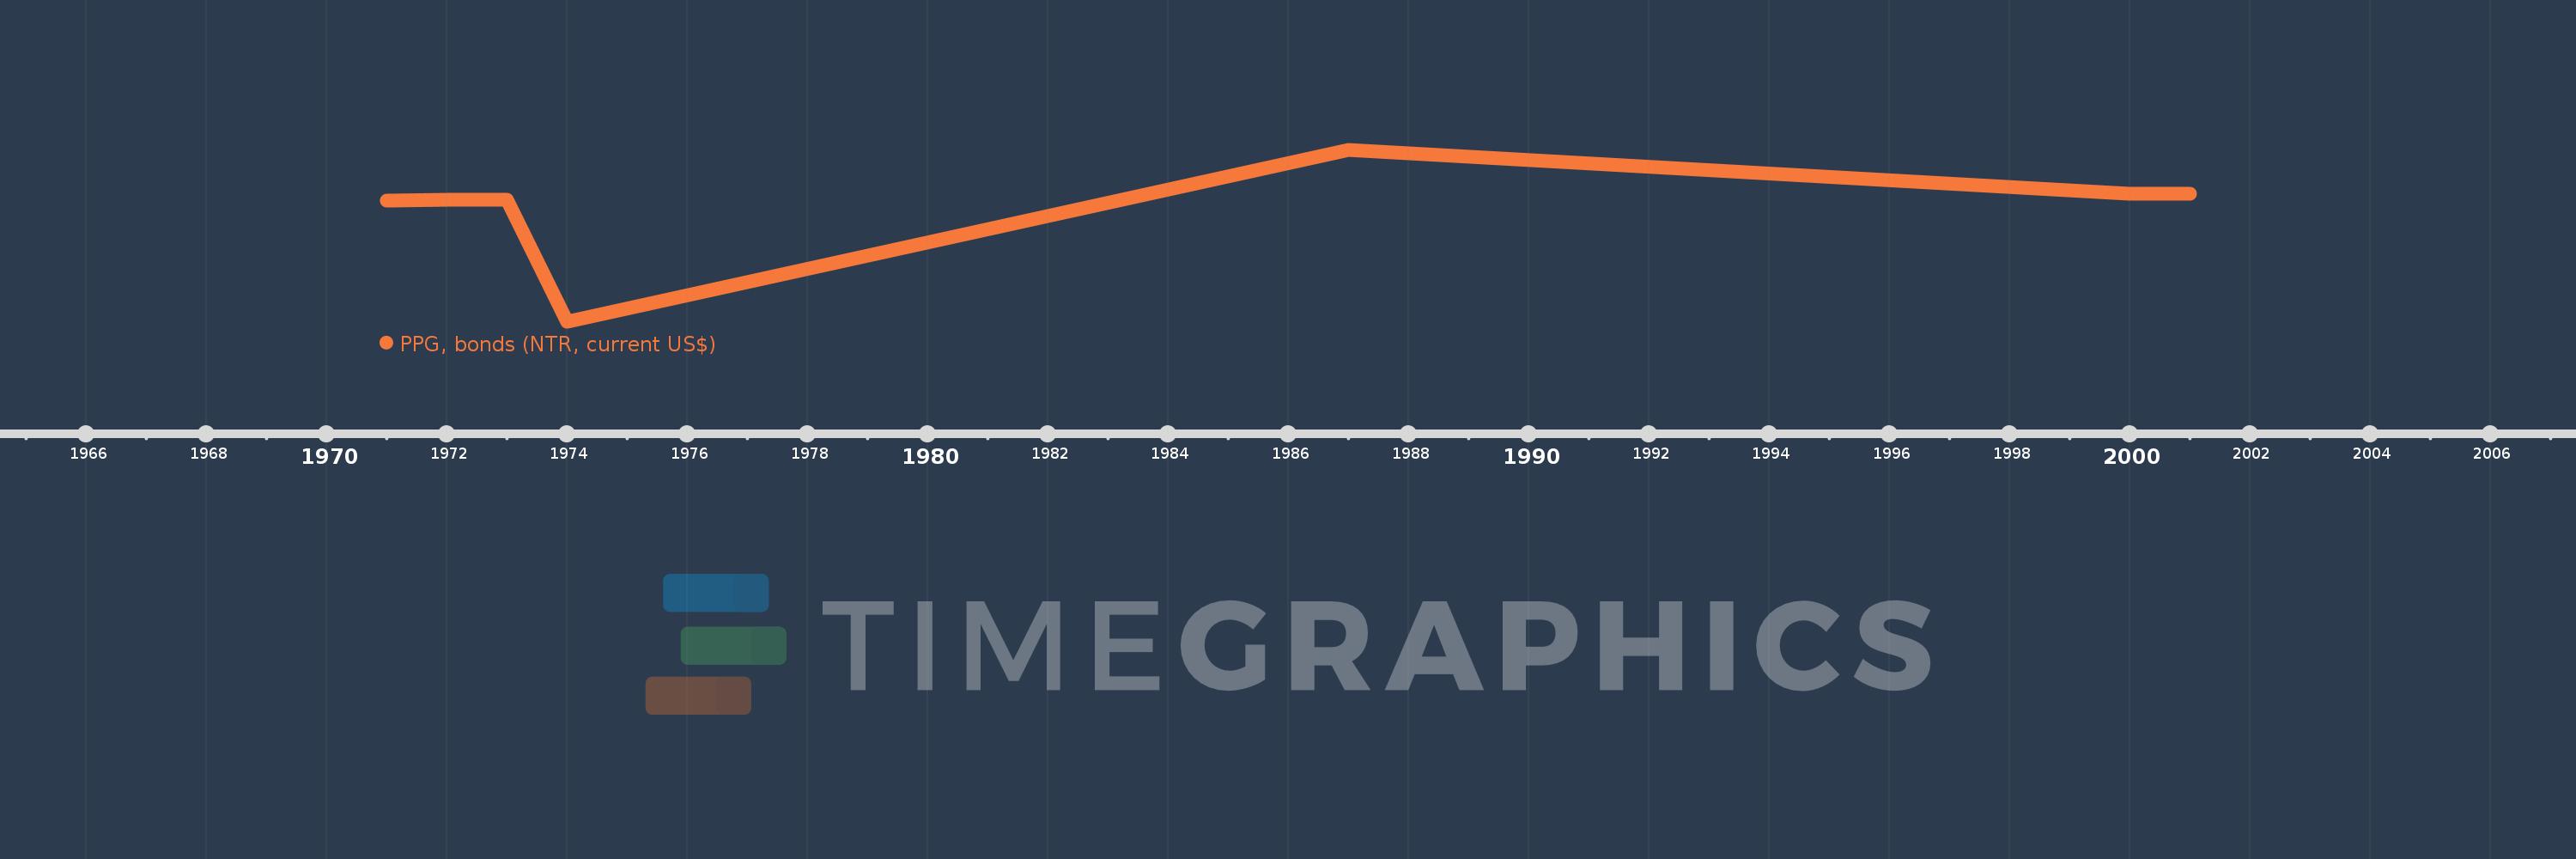
PPG, bonds (NTR, current US$)
2001,2000,1987,1974,1973,1972,1971
This statistics in other country:
Timeline:
This timeline shows a graph from 1971 to 2001 of Uganda. No data until 1970. Number of actual observations by date: 7.
Source name:
World Development Indicators
Source organization:
World Bank, International Debt Statistics.
Categories, topics:
External Debt
Last updated:
apr 23, 2017
Indicators value changes by year
Minimum:
-10.064 mln
jan 1, 1974
Maximum:
3.441 mln
jan 1, 1987
At the date of observation
Value
Absolute change
Change from previous value
jan 1, 1971
-513.0K
-513.0K
0.0%
jan 1, 1972
-441.0K
+72.0K
-14.04%
jan 1, 1973
-435.0K
+6.0K
-1.36%
jan 1, 1974
-10.064 mln
-9.629 mln
2.21K%
jan 1, 1987
3.441 mln
+13.505 mln
-134.19%
jan 1, 2000
0.0
-3.441 mln
-100.0%
Ranking of countries by current statistics by years


Comments: