29
/
en
AIzaSyAYiBZKx7MnpbEhh9jyipgxe19OcubqV5w
April 1, 2024
232650
Samoa
WSM
true
2
1
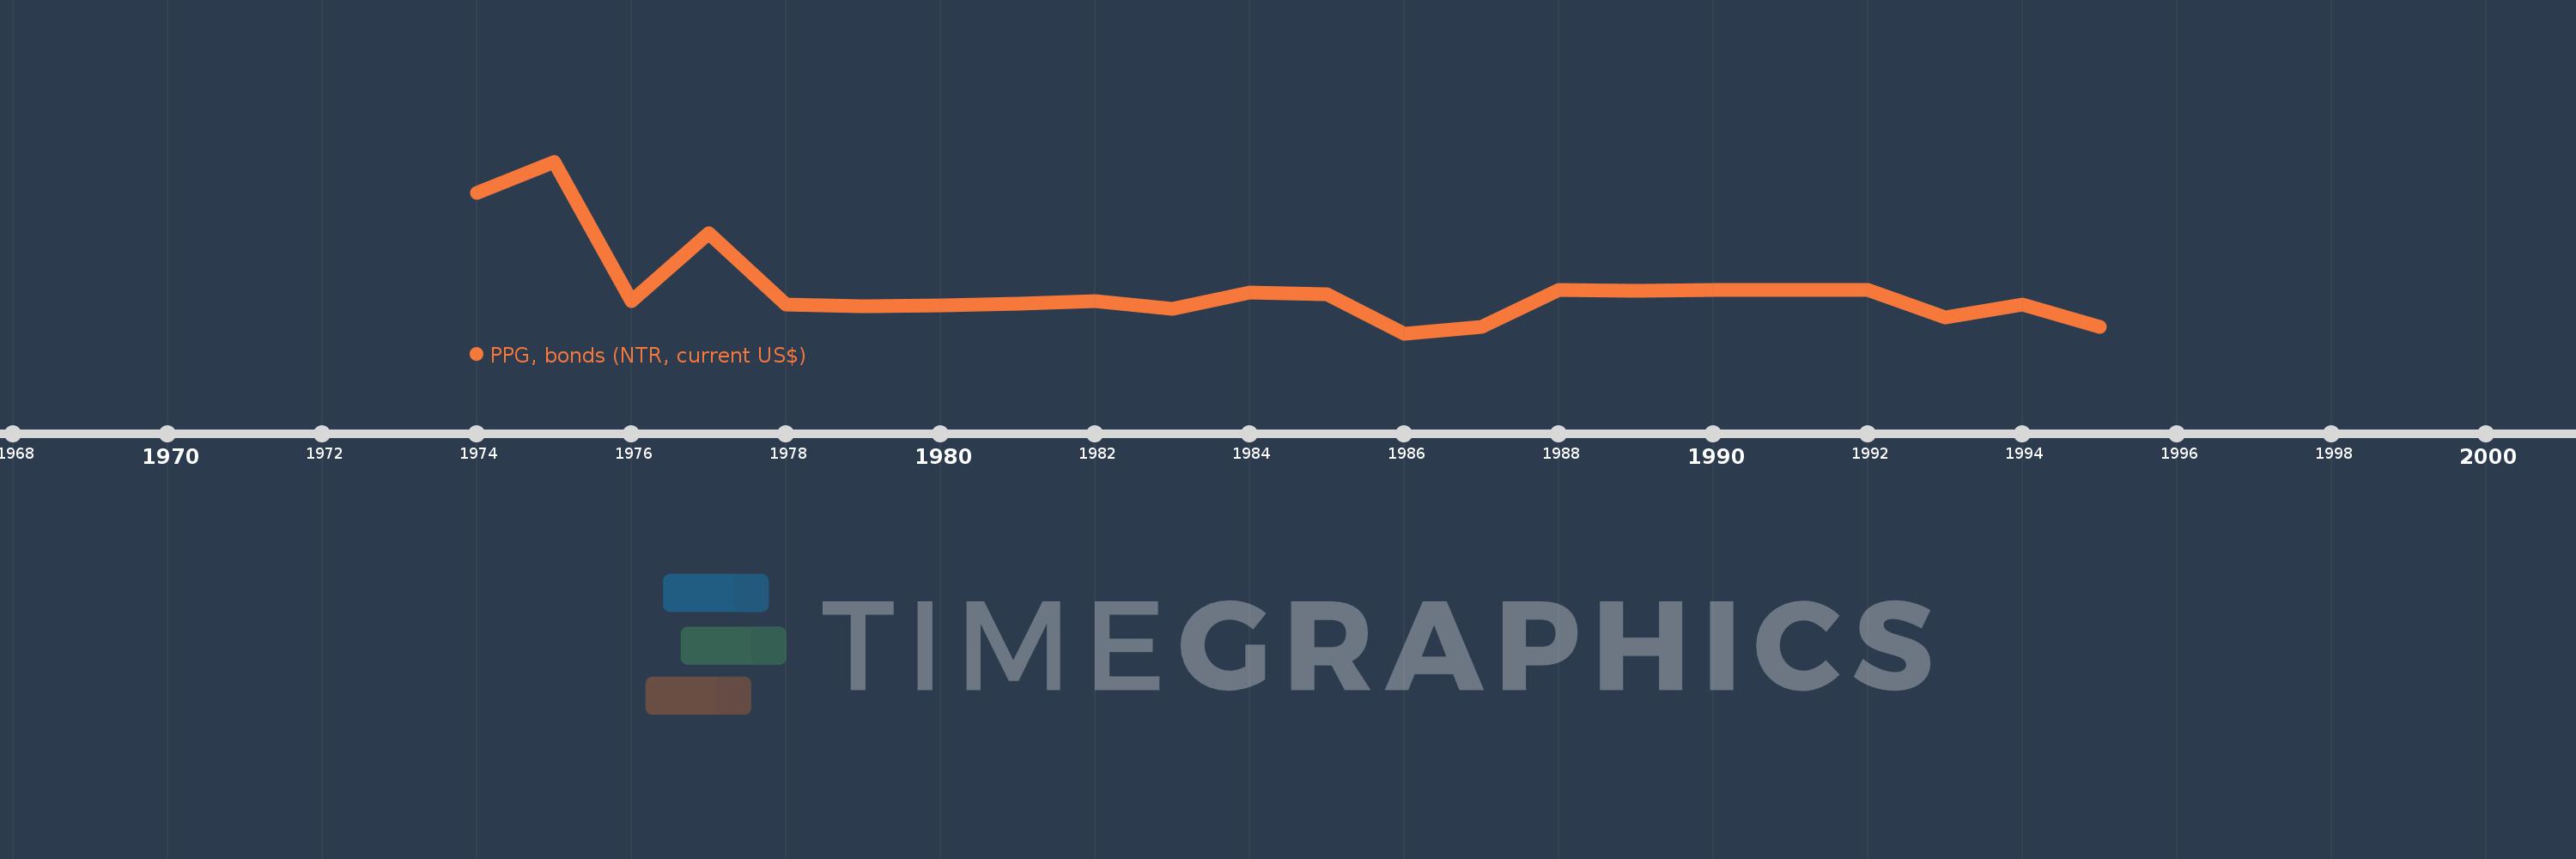
PPG, bonds (NTR, current US$)
1995,1994,1993,1992,1991,1990,1989,1988,1987,1986,1985,1984,1983,1982,1981,1980,1979,1978,1977,1976,1975,1974
This statistics in other country:
Timeline:
This timeline shows a graph from 1974 to 1995 of Samoa. No data until 1973. Number of actual observations by date: 22.
Source name:
World Development Indicators
Source organization:
World Bank, International Debt Statistics.
Categories, topics:
External Debt
Last updated:
apr 23, 2017
Indicators value changes by year
Minimum:
-731.0K
jan 1, 1986
Maximum:
1.835 mln
jan 1, 1975
At the date of observation
Value
Absolute change
Change from previous value
jan 1, 1974
1.363 mln
+1.363 mln
0.0%
jan 1, 1975
1.835 mln
+472.0K
34.63%
jan 1, 1976
-254.0K
-2.089 mln
-113.84%
jan 1, 1977
764.0K
+1.018 mln
-400.79%
jan 1, 1978
-302.0K
-1.066 mln
-139.53%
jan 1, 1979
-322.0K
-20.0K
6.62%
jan 1, 1980
-318.0K
+4.0K
-1.24%
jan 1, 1981
-282.0K
+36.0K
-11.32%
jan 1, 1982
-254.0K
+28.0K
-9.93%
jan 1, 1983
-369.0K
-115.0K
45.28%
jan 1, 1984
-120.0K
+249.0K
-67.48%
jan 1, 1985
-148.0K
-28.0K
23.33%
jan 1, 1986
-731.0K
-583.0K
393.92%
jan 1, 1987
-638.0K
+93.0K
-12.72%
jan 1, 1988
-83.0K
+555.0K
-86.99%
jan 1, 1989
-90.0K
-7.0K
8.43%
jan 1, 1990
-83.0K
+7.0K
-7.78%
jan 1, 1991
-82.0K
+1000.0
-1.2%
jan 1, 1992
-80.0K
+2.0K
-2.44%
jan 1, 1993
-492.0K
-412.0K
515.0%
jan 1, 1994
-295.0K
+197.0K
-40.04%
jan 1, 1995
-631.0K
-336.0K
113.9%
Ranking of countries by current statistics by years


Comments: