29
/
en
AIzaSyAYiBZKx7MnpbEhh9jyipgxe19OcubqV5w
April 1, 2024
168031
Kenya
KEN
true
2
1
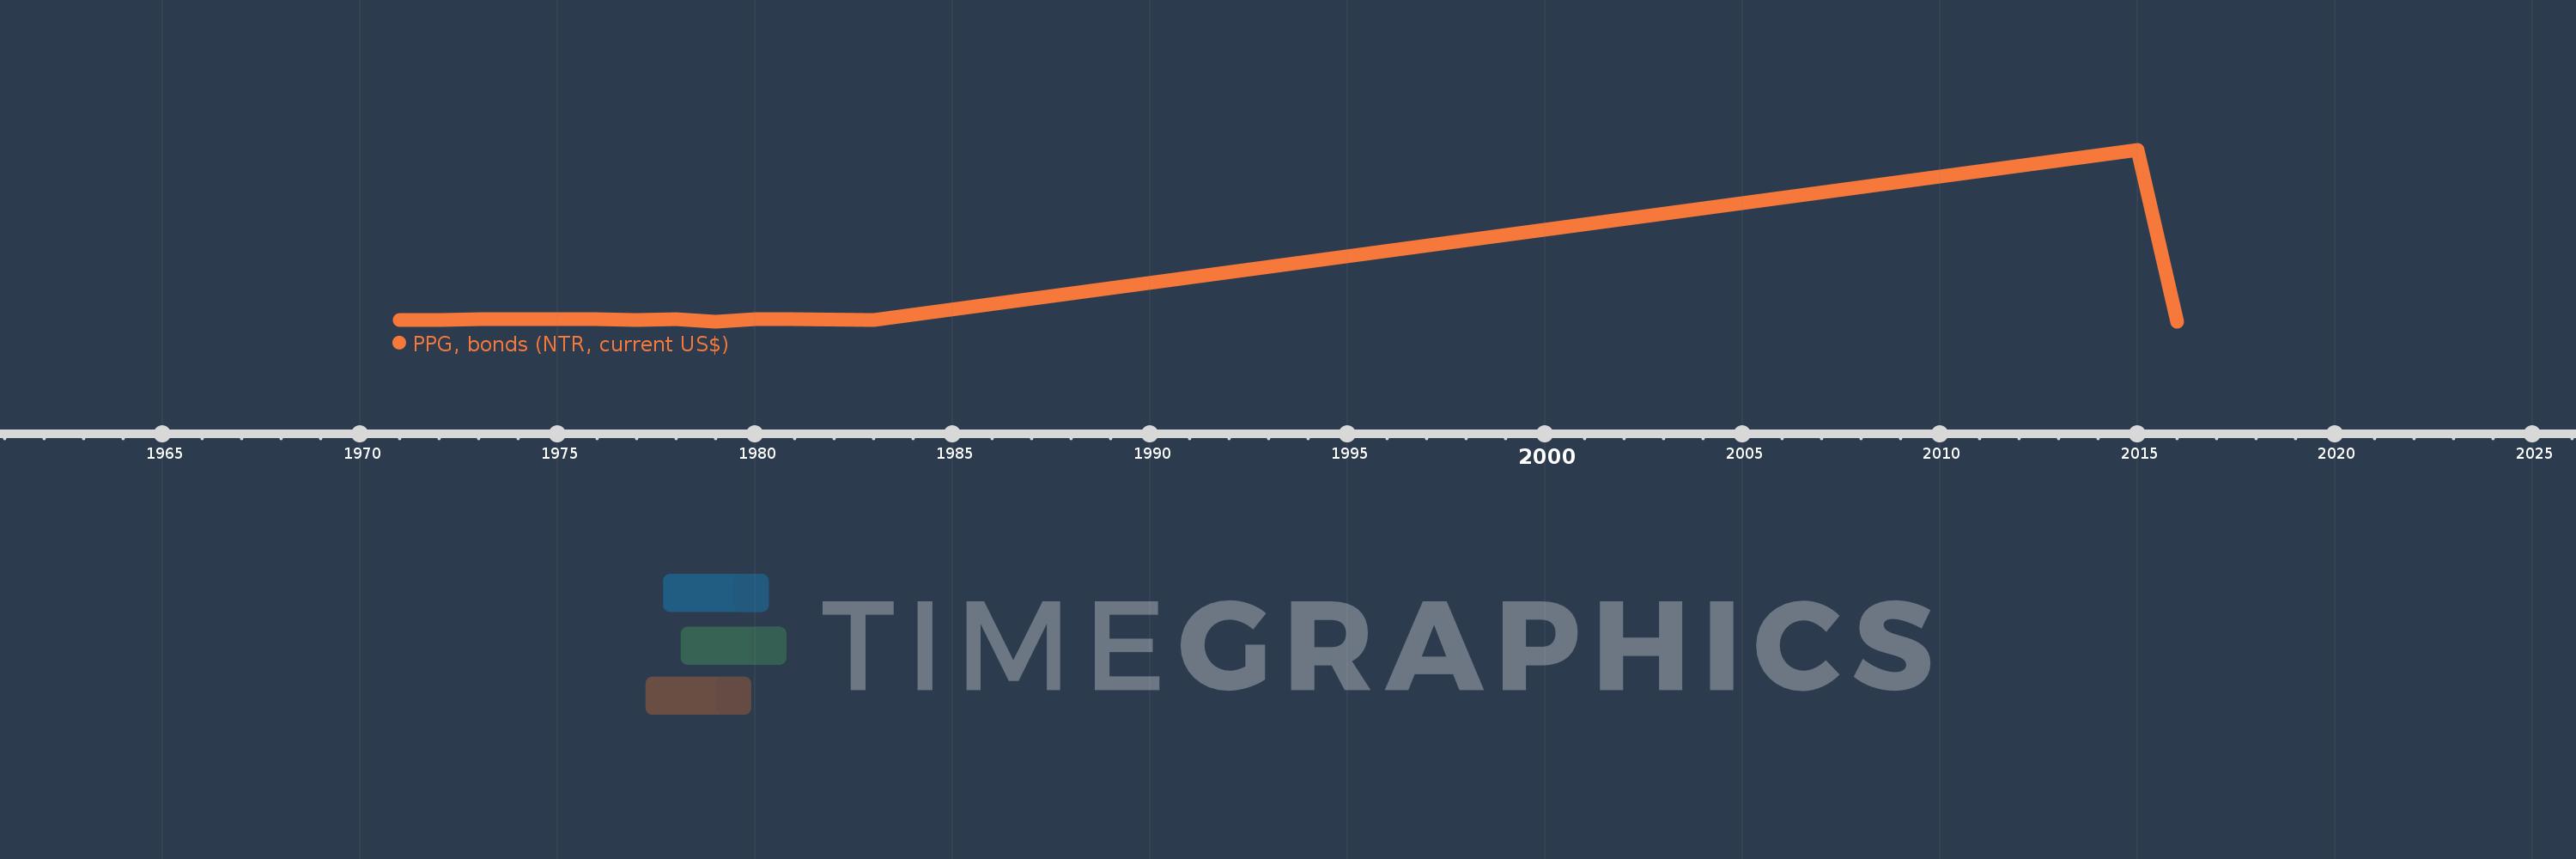
PPG, bonds (NTR, current US$)
2016,2015,1983,1981,1980,1979,1978,1977,1976,1975,1974,1973,1972,1971
This statistics in other country:
Timeline:
This timeline shows a graph from 1971 to 2016 of Kenya. No data until 1970. Number of actual observations by date: 14.
Source name:
World Development Indicators
Source organization:
World Bank, International Debt Statistics.
Categories, topics:
External Debt
Last updated:
apr 23, 2017
Indicators value changes by year
Minimum:
-44.062 mln
jan 1, 2016
Maximum:
2.75 bln
jan 1, 2015
At the date of observation
Value
Absolute change
Change from previous value
jan 1, 1971
-13.492 mln
-13.492 mln
0.0%
jan 1, 1972
-11.739 mln
+1.753 mln
-12.99%
jan 1, 1973
-2.727 mln
+9.012 mln
-76.77%
jan 1, 1974
-2.681 mln
+46.0K
-1.69%
jan 1, 1975
-2.558 mln
+123.0K
-4.59%
jan 1, 1976
-4.744 mln
-2.186 mln
85.46%
jan 1, 1977
-5.167 mln
-423.0K
8.92%
jan 1, 1978
-1.729 mln
+3.438 mln
-66.54%
jan 1, 1979
-36.29 mln
-34.561 mln
2.0K%
jan 1, 1980
-448.0K
+35.842 mln
-98.77%
jan 1, 1981
-1.447 mln
-999.0K
222.99%
jan 1, 1983
-7.396 mln
-5.949 mln
411.13%
jan 1, 2015
2.75 bln
+2.757 bln
-37.28K%
jan 1, 2016
-44.062 mln
-2.794 bln
-101.6%
Ranking of countries by current statistics by years


Comments: