29
/
en
AIzaSyAYiBZKx7MnpbEhh9jyipgxe19OcubqV5w
April 1, 2024
78663
Bangladesh
BGD
true
2
1
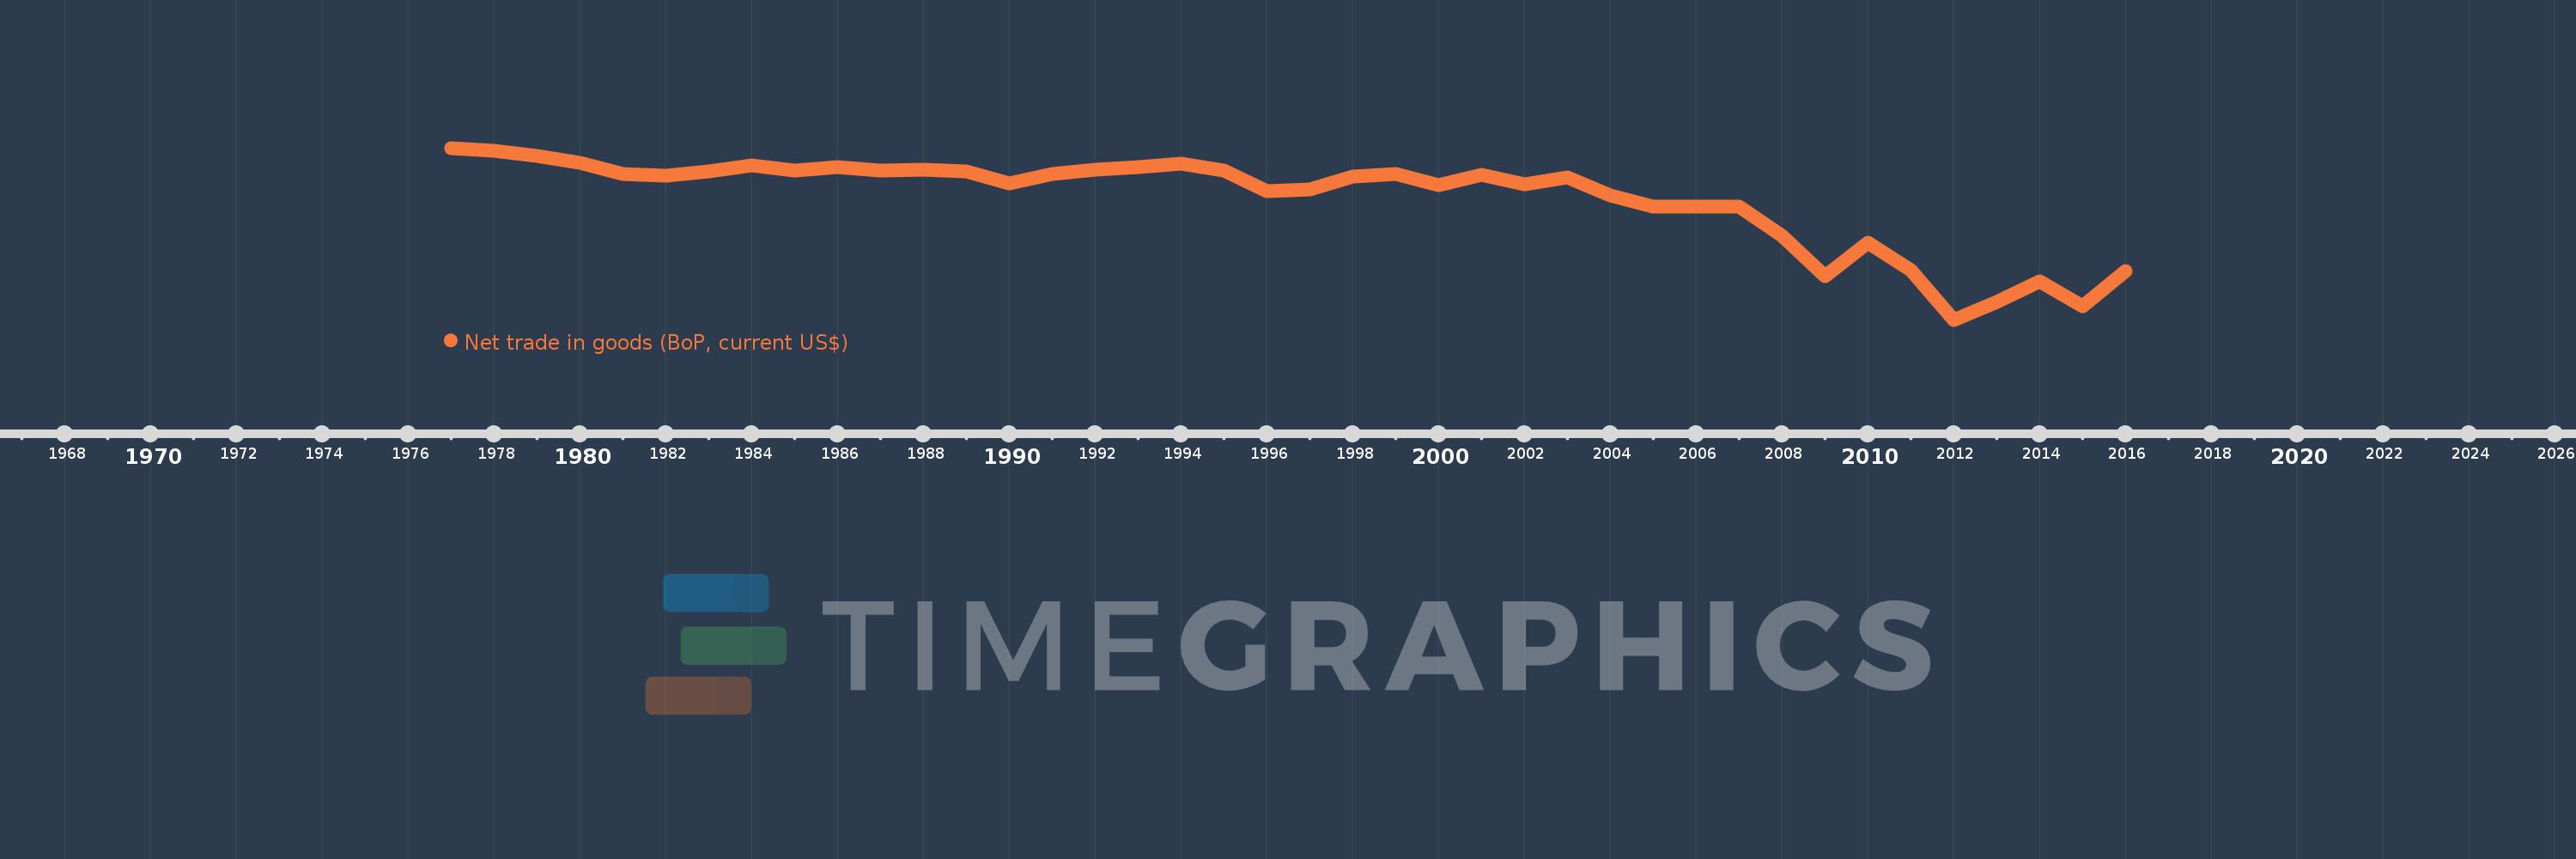
Net trade in goods (BoP, current US$)
2016,2015,2014,2013,2012,2011,2010,2009,2008,2007,2006,2005,2004,2003,2002,2001,2000,1999,1998,1997,1996,1995,1994,1993,1992,1991,1990,1989,1988,1987,1986,1985,1984,1983,1982,1981,1980,1979,1978,1977
This statistics in other country:
AfghanistanAlbaniaAlgeriaAngolaAntigua and BarbudaArgentinaArmeniaArubaAustraliaAustriaAzerbaijanBahamas, TheBahrainBangladeshBarbadosBelarusBelgiumBelizeBeninBermudaBhutanBoliviaBosnia and HerzegovinaBotswanaBrazilBrunei DarussalamBulgariaBurkina FasoBurundiCabo VerdeCambodiaCameroonCanadaCentral African RepublicChadChileChinaColombiaComorosCongo, Dem. Rep.Congo, Rep.Costa RicaCote d'IvoireCroatiaCuracaoCyprusCzech RepublicDenmarkDjiboutiDominicaDominican RepublicEcuadorEgypt, Arab Rep.El SalvadorEquatorial GuineaEritreaEstoniaEthiopiaEuro areaFaroe IslandsFijiFinlandFranceFrench PolynesiaGabonGambia, TheGeorgiaGermanyGhanaGreeceGrenadaGuatemalaGuineaGuinea-BissauGuyanaHaitiHondurasHong Kong SAR, ChinaHungaryIcelandIndiaIndonesiaIran, Islamic Rep.IraqIrelandIsraelItalyJamaicaJapanJordanKazakhstanKenyaKiribatiKorea, Rep.KosovoKuwaitKyrgyz RepublicLao PDRLatviaLebanonLesothoLiberiaLibyaLithuaniaLuxembourgMacao SAR, ChinaMacedonia, FYRMadagascarMalawiMalaysiaMaldivesMaliMaltaMarshall IslandsMauritaniaMauritiusMexicoMicronesia, Fed. Sts.MoldovaMongoliaMontenegroMoroccoMozambiqueMyanmarNamibiaNepalNetherlandsNew CaledoniaNew ZealandNicaraguaNigerNigeriaNorwayOmanPakistanPalauPanamaPapua New GuineaParaguayPeruPhilippinesPolandPortugalQatarRomaniaRussian FederationRwandaSamoaSao Tome and PrincipeSaudi ArabiaSenegalSerbiaSeychellesSierra LeoneSingaporeSint Maarten (Dutch part)Slovak RepublicSloveniaSolomon IslandsSouth AfricaSouth SudanSpainSri LankaSt. Kitts and NevisSt. LuciaSt. Vincent and the GrenadinesSudanSurinameSwazilandSwedenSwitzerlandSyrian Arab RepublicTajikistanTanzaniaThailandTimor-LesteTogoTongaTrinidad and TobagoTunisiaTurkeyTuvaluUgandaUkraineUnited KingdomUnited StatesUruguayVanuatuVenezuela, RBVietnamWest Bank and GazaYemen, Rep.ZambiaZimbabwe Timeline:
This timeline shows a graph from 1977 to 2016 of Bangladesh. No data until 1976. Number of actual observations by date: 40.
Source name:
World Development Indicators
Source organization:
International Monetary Fund, Balance of Payments Statistics Yearbook and data files.
Categories, topics:
Economy & Growth, Trade
Last updated:
apr 23, 2017
Indicators value changes by year
Minimum:
-8.07 bln
jan 1, 2012
Maximum:
-417.149 mln
jan 1, 1977
At the date of observation
Value
Absolute change
Change from previous value
jan 1, 1977
-417.149 mln
-417.149 mln
0.0%
jan 1, 1978
-542.625 mln
-125.476 mln
30.08%
jan 1, 1979
-790.338 mln
-247.713 mln
45.65%
jan 1, 1980
-1.07 bln
-279.843 mln
35.41%
jan 1, 1981
-1.56 bln
-489.428 mln
45.73%
jan 1, 1982
-1.644 bln
-84.693 mln
5.43%
jan 1, 1983
-1.453 bln
+191.657 mln
-11.66%
jan 1, 1984
-1.207 bln
+245.876 mln
-16.93%
jan 1, 1985
-1.408 bln
-201.497 mln
16.7%
jan 1, 1986
-1.287 bln
+121.299 mln
-8.61%
jan 1, 1987
-1.421 bln
-133.747 mln
10.39%
jan 1, 1988
-1.369 bln
+51.961 mln
-3.66%
jan 1, 1989
-1.443 bln
-74.636 mln
5.45%
jan 1, 1990
-1.995 bln
-551.9 mln
38.24%
jan 1, 1991
-1.587 bln
+408.332 mln
-20.46%
jan 1, 1992
-1.386 bln
+201.164 mln
-12.68%
jan 1, 1993
-1.256 bln
+129.867 mln
-9.37%
jan 1, 1994
-1.113 bln
+143.327 mln
-11.41%
jan 1, 1995
-1.416 bln
-303.51 mln
27.28%
jan 1, 1996
-2.324 bln
-907.984 mln
64.12%
jan 1, 1997
-2.254 bln
+70.033 mln
-3.01%
jan 1, 1998
-1.708 bln
+546.557 mln
-24.25%
jan 1, 1999
-1.573 bln
+134.884 mln
-7.9%
jan 1, 2000
-2.061 bln
-488.412 mln
31.06%
jan 1, 2001
-1.627 bln
+434.038 mln
-21.06%
jan 1, 2002
-2.033 bln
-406.069 mln
24.96%
jan 1, 2003
-1.72 bln
+313.103 mln
-15.4%
jan 1, 2004
-2.539 bln
-818.652 mln
47.6%
jan 1, 2005
-3.043 bln
-504.826 mln
19.89%
jan 1, 2006
-3.026 bln
+17.742 mln
-0.58%
jan 1, 2007
-3.012 bln
+13.838 mln
-0.46%
jan 1, 2008
-4.332 bln
-1.32 bln
43.83%
jan 1, 2009
-6.113 bln
-1.781 bln
41.1%
jan 1, 2010
-4.626 bln
+1.487 bln
-24.32%
jan 1, 2011
-5.872 bln
-1.246 bln
26.94%
jan 1, 2012
-8.07 bln
-2.198 bln
37.43%
jan 1, 2013
-7.266 bln
+803.698 mln
-9.96%
jan 1, 2014
-6.362 bln
+904.099 mln
-12.44%
jan 1, 2015
-7.482 bln
-1.12 bln
17.6%
jan 1, 2016
-5.891 bln
+1.591 bln
-21.26%
Ranking of countries by current statistics by years


Comments: