29
/
en
AIzaSyAYiBZKx7MnpbEhh9jyipgxe19OcubqV5w
April 1, 2024
156417
Indonesia
IDN
true
2
1
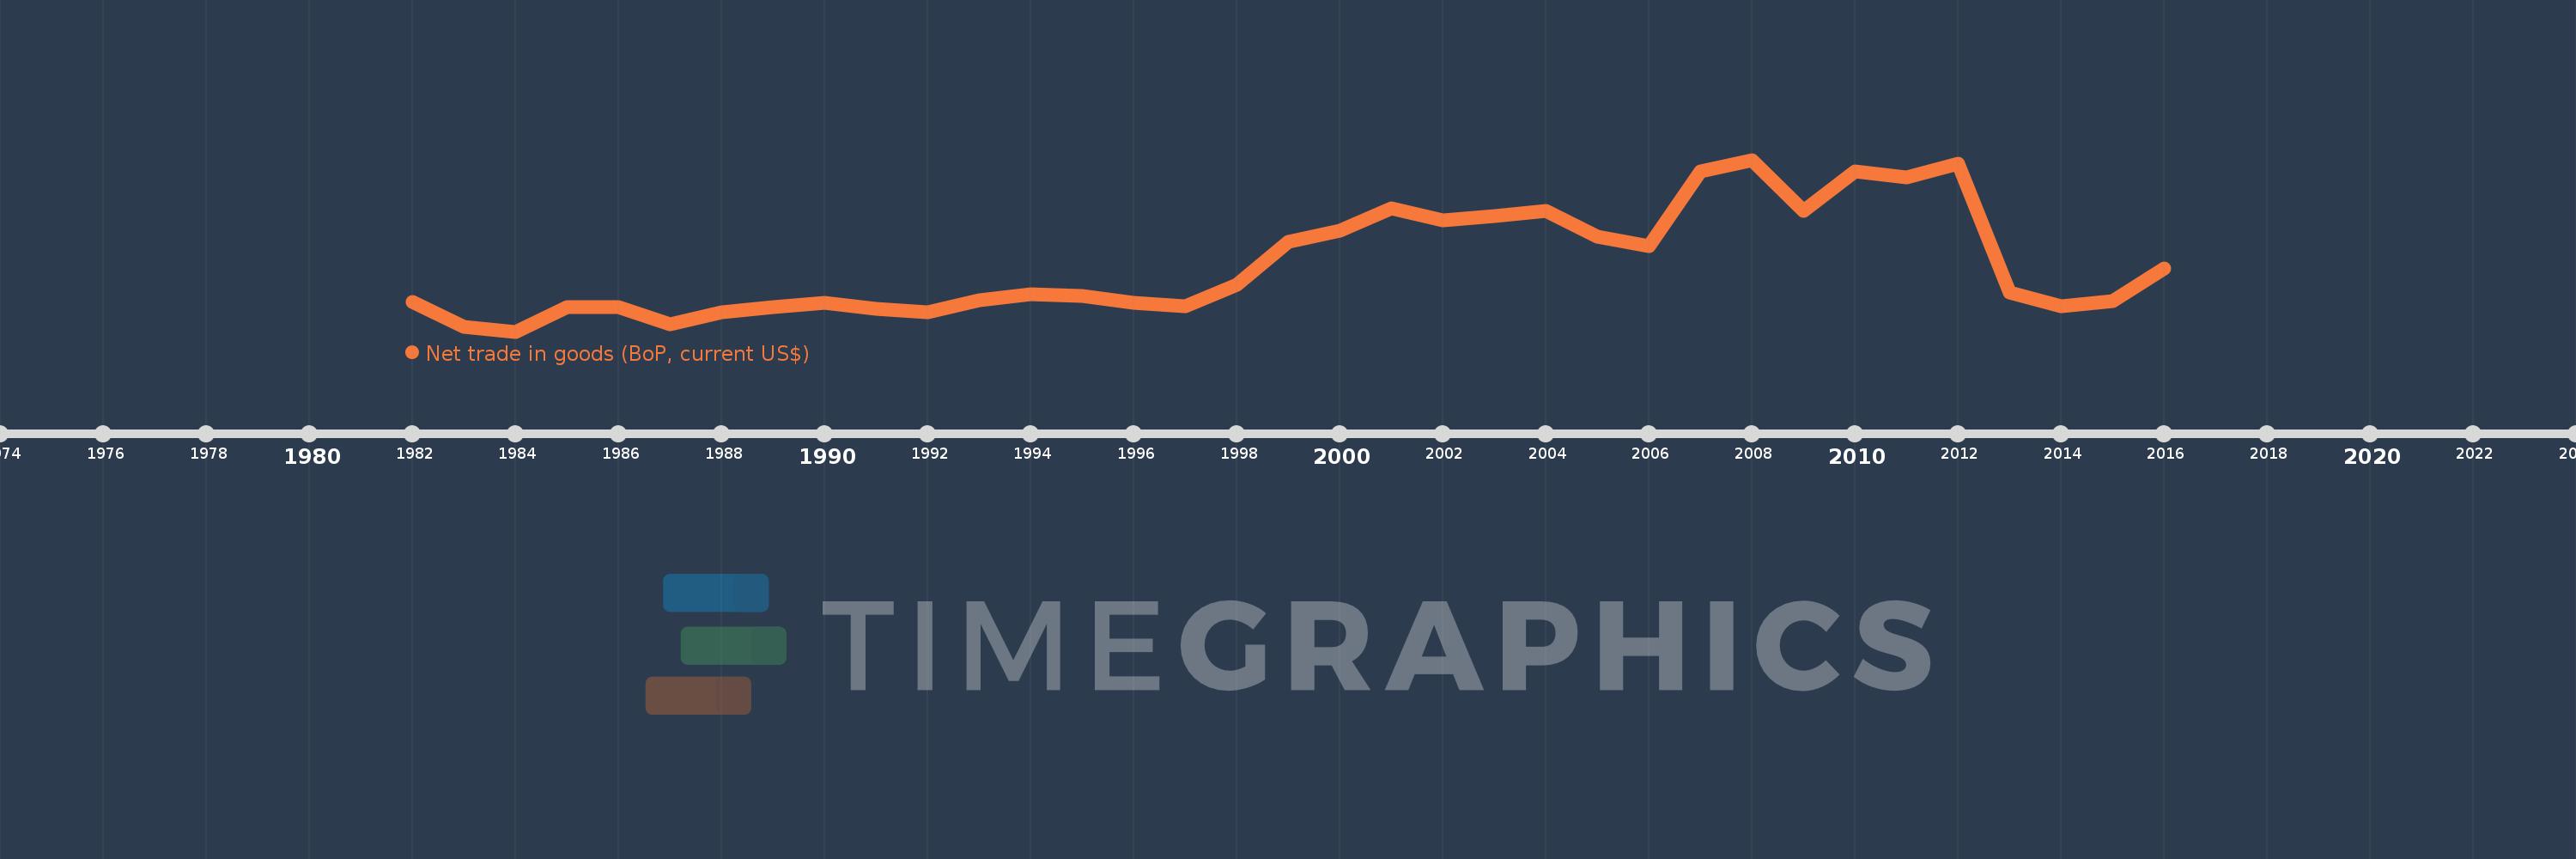
Net trade in goods (BoP, current US$)
2016,2015,2014,2013,2012,2011,2010,2009,2008,2007,2006,2005,2004,2003,2002,2001,2000,1999,1998,1997,1996,1995,1994,1993,1992,1991,1990,1989,1988,1987,1986,1985,1984,1983,1982
This statistics in other country:
AfghanistanAlbaniaAlgeriaAngolaAntigua and BarbudaArgentinaArmeniaArubaAustraliaAustriaAzerbaijanBahamas, TheBahrainBangladeshBarbadosBelarusBelgiumBelizeBeninBermudaBhutanBoliviaBosnia and HerzegovinaBotswanaBrazilBrunei DarussalamBulgariaBurkina FasoBurundiCabo VerdeCambodiaCameroonCanadaCentral African RepublicChadChileChinaColombiaComorosCongo, Dem. Rep.Congo, Rep.Costa RicaCote d'IvoireCroatiaCuracaoCyprusCzech RepublicDenmarkDjiboutiDominicaDominican RepublicEcuadorEgypt, Arab Rep.El SalvadorEquatorial GuineaEritreaEstoniaEthiopiaEuro areaFaroe IslandsFijiFinlandFranceFrench PolynesiaGabonGambia, TheGeorgiaGermanyGhanaGreeceGrenadaGuatemalaGuineaGuinea-BissauGuyanaHaitiHondurasHong Kong SAR, ChinaHungaryIcelandIndiaIndonesiaIran, Islamic Rep.IraqIrelandIsraelItalyJamaicaJapanJordanKazakhstanKenyaKiribatiKorea, Rep.KosovoKuwaitKyrgyz RepublicLao PDRLatviaLebanonLesothoLiberiaLibyaLithuaniaLuxembourgMacao SAR, ChinaMacedonia, FYRMadagascarMalawiMalaysiaMaldivesMaliMaltaMarshall IslandsMauritaniaMauritiusMexicoMicronesia, Fed. Sts.MoldovaMongoliaMontenegroMoroccoMozambiqueMyanmarNamibiaNepalNetherlandsNew CaledoniaNew ZealandNicaraguaNigerNigeriaNorwayOmanPakistanPalauPanamaPapua New GuineaParaguayPeruPhilippinesPolandPortugalQatarRomaniaRussian FederationRwandaSamoaSao Tome and PrincipeSaudi ArabiaSenegalSerbiaSeychellesSierra LeoneSingaporeSint Maarten (Dutch part)Slovak RepublicSloveniaSolomon IslandsSouth AfricaSouth SudanSpainSri LankaSt. Kitts and NevisSt. LuciaSt. Vincent and the GrenadinesSudanSurinameSwazilandSwedenSwitzerlandSyrian Arab RepublicTajikistanTanzaniaThailandTimor-LesteTogoTongaTrinidad and TobagoTunisiaTurkeyTuvaluUgandaUkraineUnited KingdomUnited StatesUruguayVanuatuVenezuela, RBVietnamWest Bank and GazaYemen, Rep.ZambiaZimbabwe Timeline:
This timeline shows a graph from 1982 to 2016 of Indonesia. No data until 1981. Number of actual observations by date: 35.
Source name:
World Development Indicators
Source organization:
International Monetary Fund, Balance of Payments Statistics Yearbook and data files.
Categories, topics:
Economy & Growth, Trade
Last updated:
apr 23, 2017
Indicators value changes by year
Minimum:
963.0 mln
jan 1, 1984
Maximum:
34.526 bln
jan 1, 2008
At the date of observation
Value
Absolute change
Change from previous value
jan 1, 1982
6.806 bln
+6.806 bln
0.0%
jan 1, 1983
1.893 bln
-4.913 bln
-72.19%
jan 1, 1984
963.0 mln
-930.0 mln
-49.13%
jan 1, 1985
5.707 bln
+4.744 bln
492.63%
jan 1, 1986
5.822 bln
+115.0 mln
2.02%
jan 1, 1987
2.458 bln
-3.364 bln
-57.78%
jan 1, 1988
4.674 bln
+2.216 bln
90.15%
jan 1, 1989
5.678 bln
+1.004 bln
21.48%
jan 1, 1990
6.664 bln
+986.0 mln
17.37%
jan 1, 1991
5.352 bln
-1.312 bln
-19.69%
jan 1, 1992
4.801 bln
-551.0 mln
-10.3%
jan 1, 1993
7.022 bln
+2.221 bln
46.26%
jan 1, 1994
8.231 bln
+1.209 bln
17.22%
jan 1, 1995
7.901 bln
-330.0 mln
-4.01%
jan 1, 1996
6.533 bln
-1.368 bln
-17.31%
jan 1, 1997
5.948 bln
-585.0 mln
-8.95%
jan 1, 1998
10.075 bln
+4.127 bln
69.38%
jan 1, 1999
18.429 bln
+8.354 bln
82.92%
jan 1, 2000
20.643 bln
+2.215 bln
12.02%
jan 1, 2001
25.042 bln
+4.399 bln
21.31%
jan 1, 2002
22.696 bln
-2.346 bln
-9.37%
jan 1, 2003
23.513 bln
+817.16 mln
3.6%
jan 1, 2004
24.563 bln
+1.05 bln
4.46%
jan 1, 2005
19.468 bln
-5.095 bln
-20.74%
jan 1, 2006
17.611 bln
-1.857 bln
-9.54%
jan 1, 2007
32.198 bln
+14.587 bln
82.83%
jan 1, 2008
34.526 bln
+2.328 bln
7.23%
jan 1, 2009
24.542 bln
-9.983 bln
-28.92%
jan 1, 2010
32.287 bln
+7.745 bln
31.56%
jan 1, 2011
31.003 bln
-1.285 bln
-3.98%
jan 1, 2012
33.825 bln
+2.822 bln
9.1%
jan 1, 2013
8.68 bln
-25.145 bln
-74.34%
jan 1, 2014
5.833 bln
-2.846 bln
-32.79%
jan 1, 2015
6.983 bln
+1.149 bln
19.7%
jan 1, 2016
13.289 bln
+6.307 bln
90.32%
Ranking of countries by current statistics by years


Comments: