29
/
en
AIzaSyAYiBZKx7MnpbEhh9jyipgxe19OcubqV5w
April 1, 2024
257625
Switzerland
CHE
true
2
1
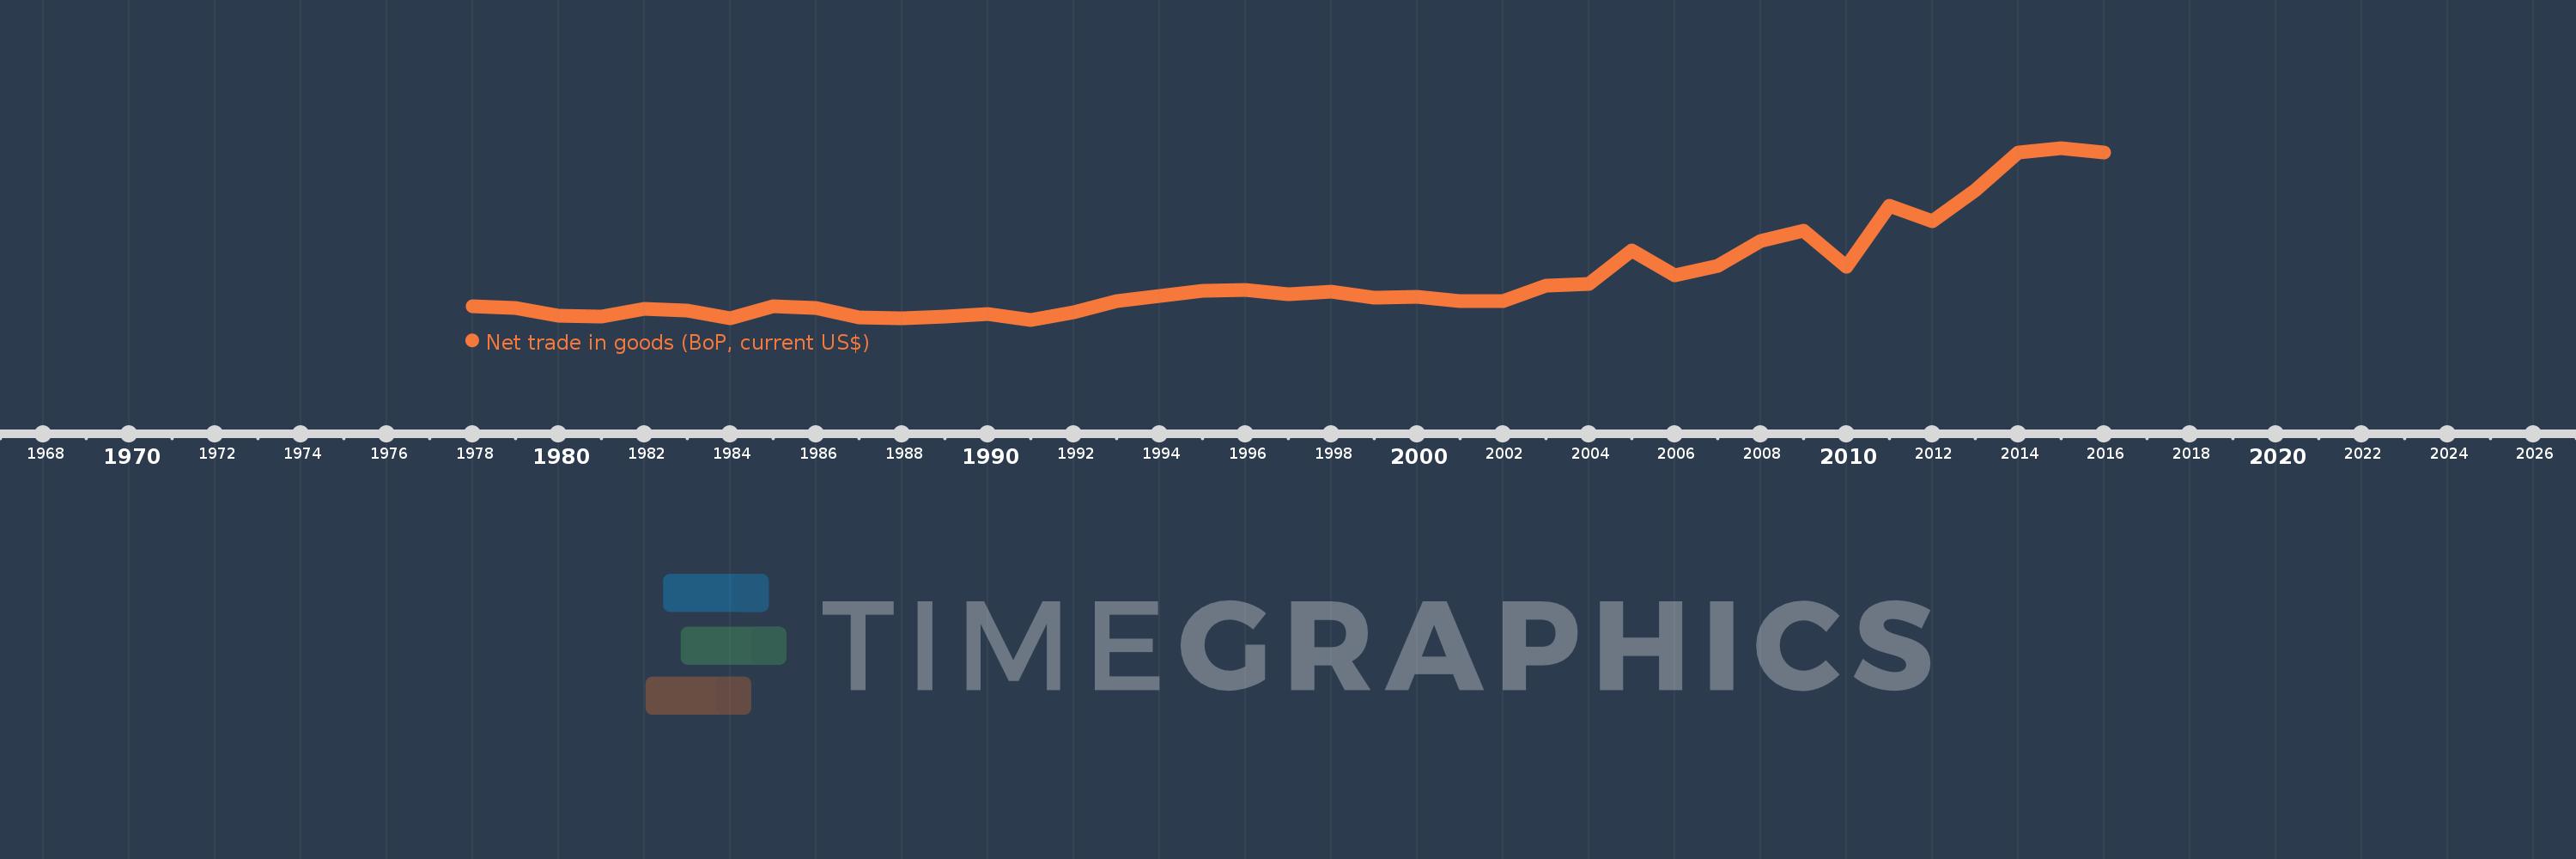
Net trade in goods (BoP, current US$)
2016,2015,2014,2013,2012,2011,2010,2009,2008,2007,2006,2005,2004,2003,2002,2001,2000,1999,1998,1997,1996,1995,1994,1993,1992,1991,1990,1989,1988,1987,1986,1985,1984,1983,1982,1981,1980,1979,1978
This statistics in other country:
AfghanistanAlbaniaAlgeriaAngolaAntigua and BarbudaArgentinaArmeniaArubaAustraliaAustriaAzerbaijanBahamas, TheBahrainBangladeshBarbadosBelarusBelgiumBelizeBeninBermudaBhutanBoliviaBosnia and HerzegovinaBotswanaBrazilBrunei DarussalamBulgariaBurkina FasoBurundiCabo VerdeCambodiaCameroonCanadaCentral African RepublicChadChileChinaColombiaComorosCongo, Dem. Rep.Congo, Rep.Costa RicaCote d'IvoireCroatiaCuracaoCyprusCzech RepublicDenmarkDjiboutiDominicaDominican RepublicEcuadorEgypt, Arab Rep.El SalvadorEquatorial GuineaEritreaEstoniaEthiopiaEuro areaFaroe IslandsFijiFinlandFranceFrench PolynesiaGabonGambia, TheGeorgiaGermanyGhanaGreeceGrenadaGuatemalaGuineaGuinea-BissauGuyanaHaitiHondurasHong Kong SAR, ChinaHungaryIcelandIndiaIndonesiaIran, Islamic Rep.IraqIrelandIsraelItalyJamaicaJapanJordanKazakhstanKenyaKiribatiKorea, Rep.KosovoKuwaitKyrgyz RepublicLao PDRLatviaLebanonLesothoLiberiaLibyaLithuaniaLuxembourgMacao SAR, ChinaMacedonia, FYRMadagascarMalawiMalaysiaMaldivesMaliMaltaMarshall IslandsMauritaniaMauritiusMexicoMicronesia, Fed. Sts.MoldovaMongoliaMontenegroMoroccoMozambiqueMyanmarNamibiaNepalNetherlandsNew CaledoniaNew ZealandNicaraguaNigerNigeriaNorwayOmanPakistanPalauPanamaPapua New GuineaParaguayPeruPhilippinesPolandPortugalQatarRomaniaRussian FederationRwandaSamoaSao Tome and PrincipeSaudi ArabiaSenegalSerbiaSeychellesSierra LeoneSingaporeSint Maarten (Dutch part)Slovak RepublicSloveniaSolomon IslandsSouth AfricaSouth SudanSpainSri LankaSt. Kitts and NevisSt. LuciaSt. Vincent and the GrenadinesSudanSurinameSwazilandSwedenSwitzerlandSyrian Arab RepublicTajikistanTanzaniaThailandTimor-LesteTogoTongaTrinidad and TobagoTunisiaTurkeyTuvaluUgandaUkraineUnited KingdomUnited StatesUruguayVanuatuVenezuela, RBVietnamWest Bank and GazaYemen, Rep.ZambiaZimbabwe Timeline:
This timeline shows a graph from 1978 to 2016 of Switzerland. No data until 1977. Number of actual observations by date: 39.
Source name:
World Development Indicators
Source organization:
International Monetary Fund, Balance of Payments Statistics Yearbook and data files.
Categories, topics:
Economy & Growth, Trade
Last updated:
apr 23, 2017
Indicators value changes by year
Minimum:
-6.43 bln
jan 1, 1991
Maximum:
55.34 bln
jan 1, 2015
At the date of observation
Value
Absolute change
Change from previous value
jan 1, 1978
-1.718 bln
-1.718 bln
0.0%
jan 1, 1979
-2.178 bln
-459.34 mln
26.73%
jan 1, 1980
-4.9 bln
-2.722 bln
125.02%
jan 1, 1981
-5.25 bln
-350.288 mln
7.15%
jan 1, 1982
-2.384 bln
+2.866 bln
-54.58%
jan 1, 1983
-3.219 bln
-834.71 mln
35.01%
jan 1, 1984
-5.82 bln
-2.601 bln
80.81%
jan 1, 1985
-1.613 bln
+4.207 bln
-72.29%
jan 1, 1986
-2.083 bln
-470.346 mln
29.16%
jan 1, 1987
-5.495 bln
-3.412 bln
163.76%
jan 1, 1988
-6.017 bln
-521.691 mln
9.49%
jan 1, 1989
-5.194 bln
+822.241 mln
-13.67%
jan 1, 1990
-4.351 bln
+843.865 mln
-16.25%
jan 1, 1991
-6.43 bln
-2.08 bln
47.81%
jan 1, 1992
-3.884 bln
+2.547 bln
-39.6%
jan 1, 1993
293.019 mln
+4.177 bln
-107.54%
jan 1, 1994
2.089 bln
+1.796 bln
612.89%
jan 1, 1995
3.994 bln
+1.905 bln
91.19%
jan 1, 1996
4.137 bln
+142.908 mln
3.58%
jan 1, 1997
2.719 bln
-1.417 bln
-34.26%
jan 1, 1998
3.714 bln
+995.181 mln
36.6%
jan 1, 1999
1.655 bln
-2.059 bln
-55.44%
jan 1, 2000
1.751 bln
+95.558 mln
5.77%
jan 1, 2001
203.73 mln
-1.547 bln
-88.36%
jan 1, 2002
264.965 mln
+61.235 mln
30.06%
jan 1, 2003
5.694 bln
+5.429 bln
2.05K%
jan 1, 2004
6.548 bln
+853.257 mln
14.98%
jan 1, 2005
18.354 bln
+11.806 bln
180.31%
jan 1, 2006
9.399 bln
-8.955 bln
-48.79%
jan 1, 2007
12.806 bln
+3.407 bln
36.25%
jan 1, 2008
21.931 bln
+9.126 bln
71.26%
jan 1, 2009
25.456 bln
+3.525 bln
16.07%
jan 1, 2010
12.611 bln
-12.845 bln
-50.46%
jan 1, 2011
34.512 bln
+21.901 bln
173.66%
jan 1, 2012
29.098 bln
-5.414 bln
-15.69%
jan 1, 2013
40.192 bln
+11.094 bln
38.13%
jan 1, 2014
53.6 bln
+13.409 bln
33.36%
jan 1, 2015
55.34 bln
+1.74 bln
3.25%
jan 1, 2016
53.58 bln
-1.761 bln
-3.18%
Ranking of countries by current statistics by years


Comments: