29
/
en
AIzaSyAYiBZKx7MnpbEhh9jyipgxe19OcubqV5w
April 1, 2024
66415
Algeria
DZA
true
2
1
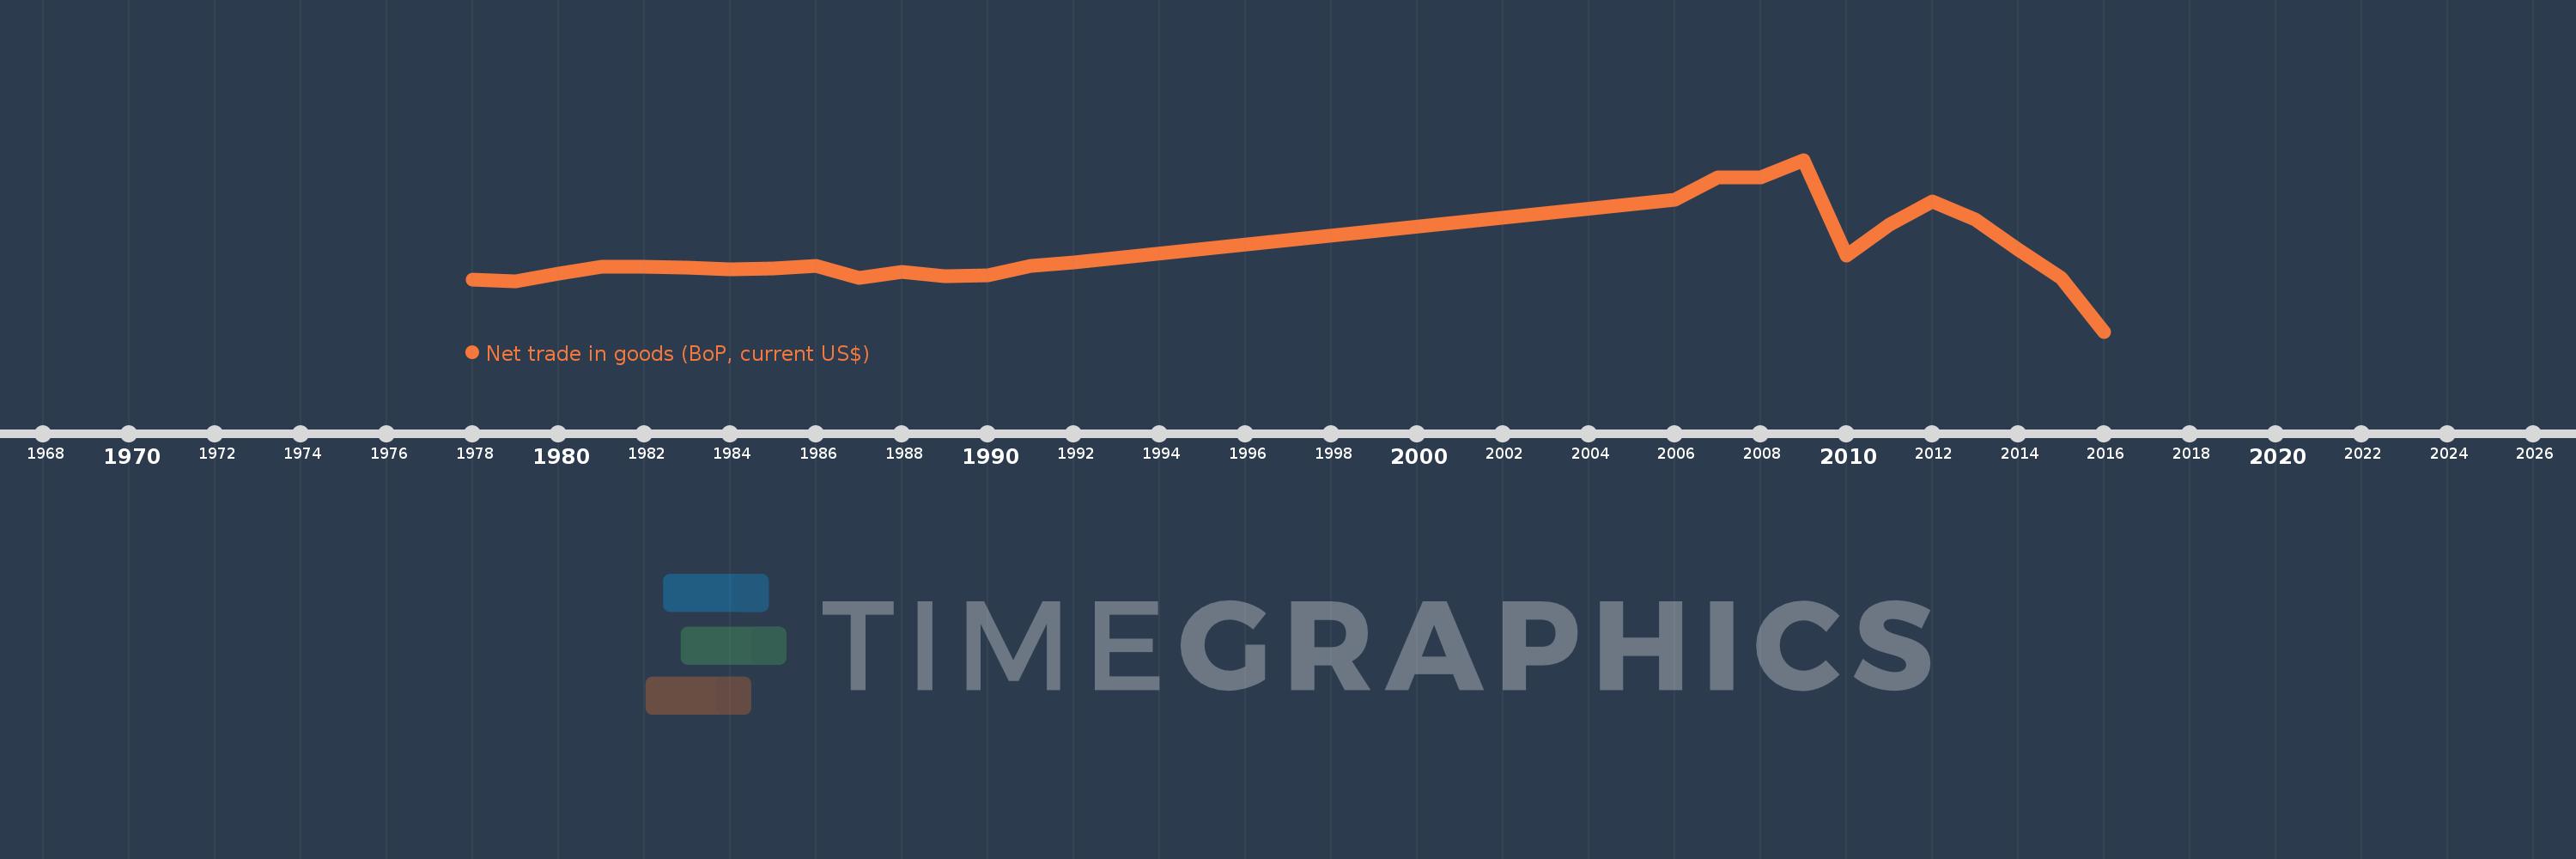
Net trade in goods (BoP, current US$)
2016,2015,2014,2013,2012,2011,2010,2009,2008,2007,2006,1992,1991,1990,1989,1988,1987,1986,1985,1984,1983,1982,1981,1980,1979,1978
This statistics in other country:
AfghanistanAlbaniaAlgeriaAngolaAntigua and BarbudaArgentinaArmeniaArubaAustraliaAustriaAzerbaijanBahamas, TheBahrainBangladeshBarbadosBelarusBelgiumBelizeBeninBermudaBhutanBoliviaBosnia and HerzegovinaBotswanaBrazilBrunei DarussalamBulgariaBurkina FasoBurundiCabo VerdeCambodiaCameroonCanadaCentral African RepublicChadChileChinaColombiaComorosCongo, Dem. Rep.Congo, Rep.Costa RicaCote d'IvoireCroatiaCuracaoCyprusCzech RepublicDenmarkDjiboutiDominicaDominican RepublicEcuadorEgypt, Arab Rep.El SalvadorEquatorial GuineaEritreaEstoniaEthiopiaEuro areaFaroe IslandsFijiFinlandFranceFrench PolynesiaGabonGambia, TheGeorgiaGermanyGhanaGreeceGrenadaGuatemalaGuineaGuinea-BissauGuyanaHaitiHondurasHong Kong SAR, ChinaHungaryIcelandIndiaIndonesiaIran, Islamic Rep.IraqIrelandIsraelItalyJamaicaJapanJordanKazakhstanKenyaKiribatiKorea, Rep.KosovoKuwaitKyrgyz RepublicLao PDRLatviaLebanonLesothoLiberiaLibyaLithuaniaLuxembourgMacao SAR, ChinaMacedonia, FYRMadagascarMalawiMalaysiaMaldivesMaliMaltaMarshall IslandsMauritaniaMauritiusMexicoMicronesia, Fed. Sts.MoldovaMongoliaMontenegroMoroccoMozambiqueMyanmarNamibiaNepalNetherlandsNew CaledoniaNew ZealandNicaraguaNigerNigeriaNorwayOmanPakistanPalauPanamaPapua New GuineaParaguayPeruPhilippinesPolandPortugalQatarRomaniaRussian FederationRwandaSamoaSao Tome and PrincipeSaudi ArabiaSenegalSerbiaSeychellesSierra LeoneSingaporeSint Maarten (Dutch part)Slovak RepublicSloveniaSolomon IslandsSouth AfricaSouth SudanSpainSri LankaSt. Kitts and NevisSt. LuciaSt. Vincent and the GrenadinesSudanSurinameSwazilandSwedenSwitzerlandSyrian Arab RepublicTajikistanTanzaniaThailandTimor-LesteTogoTongaTrinidad and TobagoTunisiaTurkeyTuvaluUgandaUkraineUnited KingdomUnited StatesUruguayVanuatuVenezuela, RBVietnamWest Bank and GazaYemen, Rep.ZambiaZimbabwe Timeline:
This timeline shows a graph from 1978 to 2016 of Algeria. No data until 1977. Number of actual observations by date: 26.
Source name:
World Development Indicators
Source organization:
International Monetary Fund, Balance of Payments Statistics Yearbook and data files.
Categories, topics:
Economy & Growth, Trade
Last updated:
apr 23, 2017
Indicators value changes by year
Minimum:
-17.841 bln
jan 1, 2016
Maximum:
40.083 bln
jan 1, 2009
At the date of observation
Value
Absolute change
Change from previous value
jan 1, 1978
-188.822 mln
-188.822 mln
0.0%
jan 1, 1979
-953.125 mln
-764.303 mln
404.77%
jan 1, 1980
1.679 bln
+2.632 bln
-276.17%
jan 1, 1981
4.056 bln
+2.376 bln
141.53%
jan 1, 1982
4.029 bln
-26.649 mln
-0.66%
jan 1, 1983
3.62 bln
-408.416 mln
-10.14%
jan 1, 1984
3.226 bln
-394.216 mln
-10.89%
jan 1, 1985
3.557 bln
+331.15 mln
10.26%
jan 1, 1986
4.223 bln
+665.691 mln
18.71%
jan 1, 1987
185.441 mln
-4.038 bln
-95.61%
jan 1, 1988
2.413 bln
+2.227 bln
1.2K%
jan 1, 1989
945.599 mln
-1.467 bln
-60.81%
jan 1, 1990
1.162 bln
+215.987 mln
22.84%
jan 1, 1991
4.187 bln
+3.025 bln
260.45%
jan 1, 1992
5.478 bln
+1.291 bln
30.83%
jan 1, 2006
26.517 bln
+21.039 bln
384.08%
jan 1, 2007
34.22 bln
+7.703 bln
29.05%
jan 1, 2008
34.082 bln
-138.082 mln
-0.4%
jan 1, 2009
40.083 bln
+6.001 bln
17.61%
jan 1, 2010
7.79 bln
-32.293 bln
-80.57%
jan 1, 2011
18.301 bln
+10.511 bln
134.94%
jan 1, 2012
25.979 bln
+7.677 bln
41.95%
jan 1, 2013
19.93 bln
-6.048 bln
-23.28%
jan 1, 2014
9.945 bln
-9.985 bln
-50.1%
jan 1, 2015
351.593 mln
-9.594 bln
-96.46%
jan 1, 2016
-17.841 bln
-18.193 bln
-5.17K%
Ranking of countries by current statistics by years


Comments: