Download This statistics in other country:
Timeline:
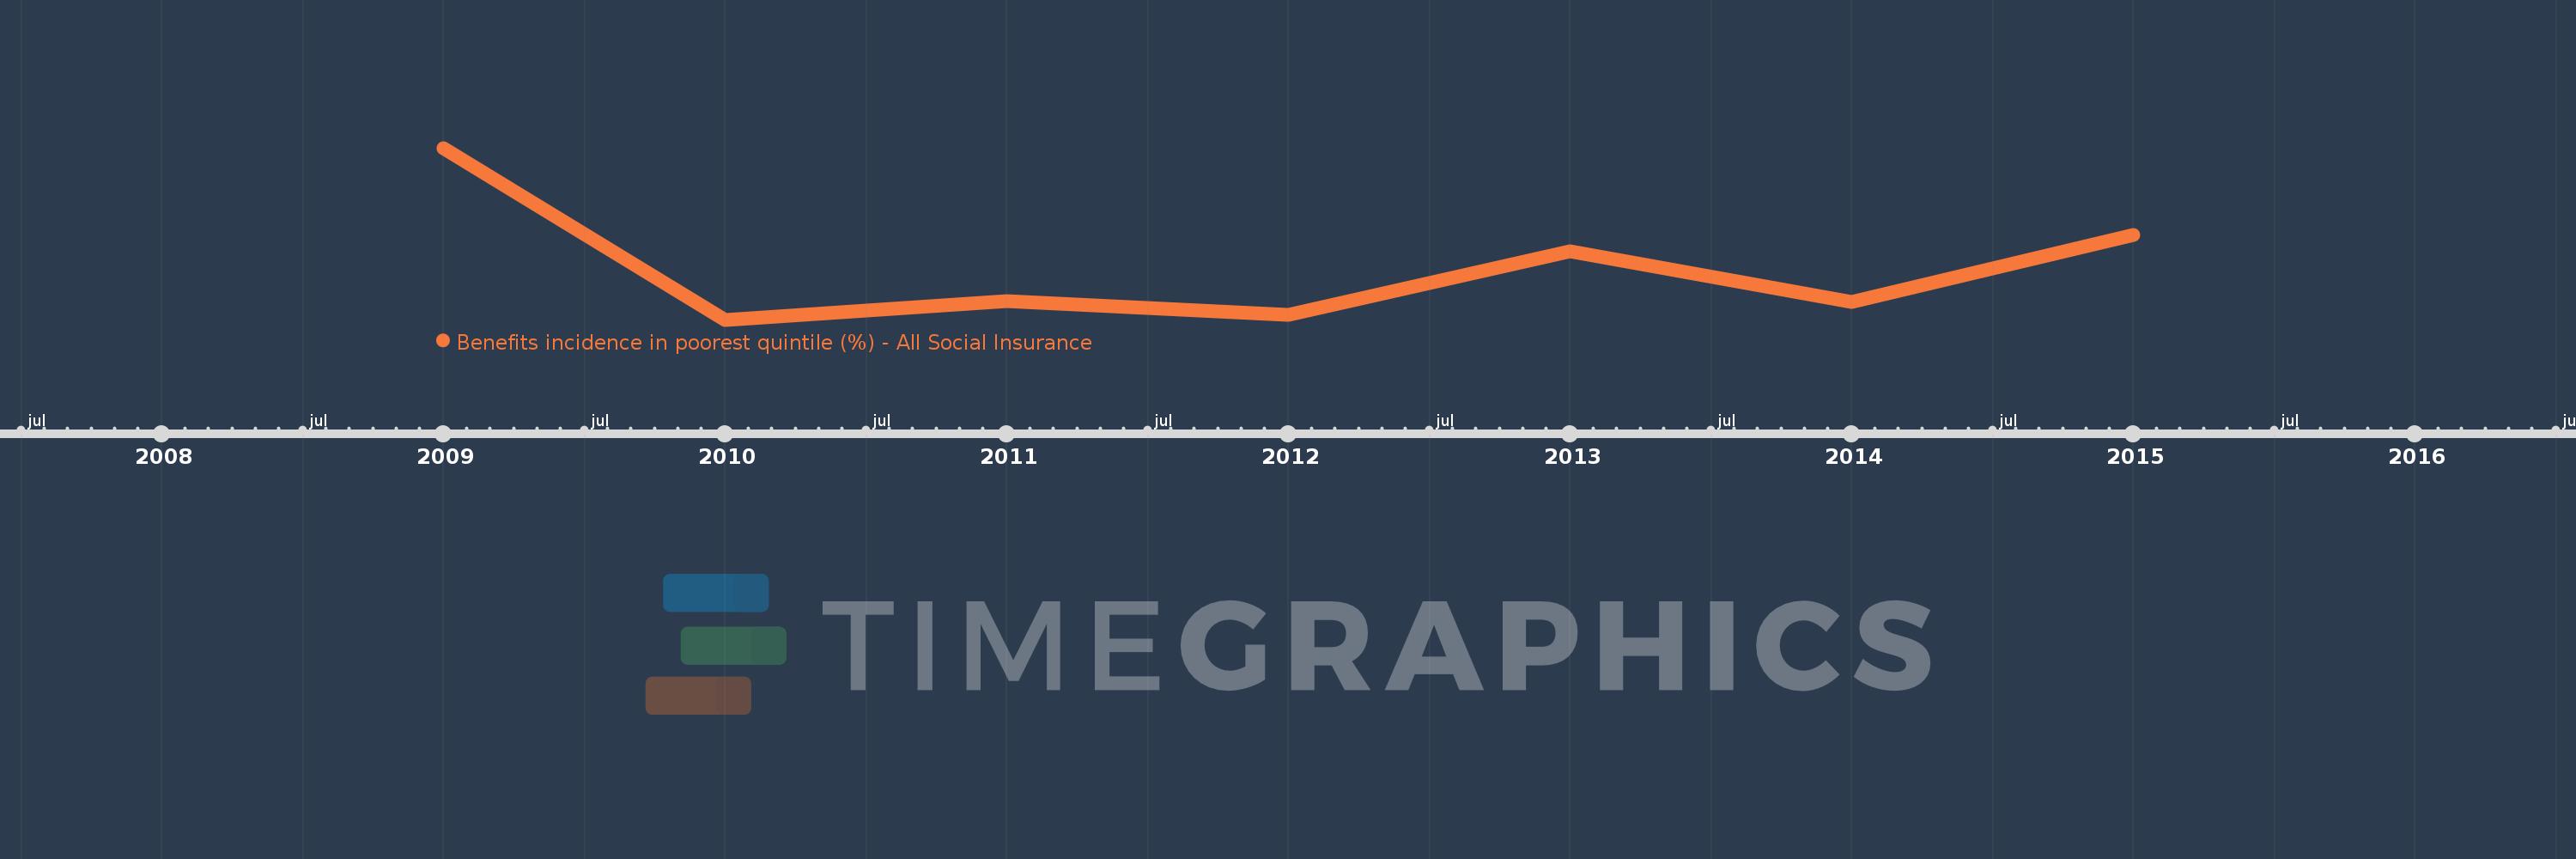
This timeline shows a graph from 2009 to 2015 of Armenia. No data until 2008. Number of actual observations by date: 7.
Source name:
World Development Indicators
Source organization:
The Atlas of Social Protection: Indicators of Resilience and Equity (ASPIRE)
Categories, topics:
Social Protection & Labor
Last updated:
apr 23, 2017
Indicators value changes by year
Minimum:
14.454
jan 1, 2010
Maximum:
17.411
jan 1, 2009
At the date of observation
Value
Absolute change
Change from the previous value
jan 1, 2009
17.411
+17.411
0.0%
jan 1, 2010
14.454
-2.957
-16.98%
jan 1, 2011
14.779
+0.324
2.24%
jan 1, 2012
14.533
-0.246
-1.66%
jan 1, 2013
15.636
+1.103
7.59%
jan 1, 2014
14.767
-0.869
-5.56%
jan 1, 2015
15.913
+1.146
7.76%
Ranking of countries by current statistics by years
