29
/
en
AIzaSyAYiBZKx7MnpbEhh9jyipgxe19OcubqV5w
April 1, 2024
121797
Dominican Republic
DOM
true
2
1
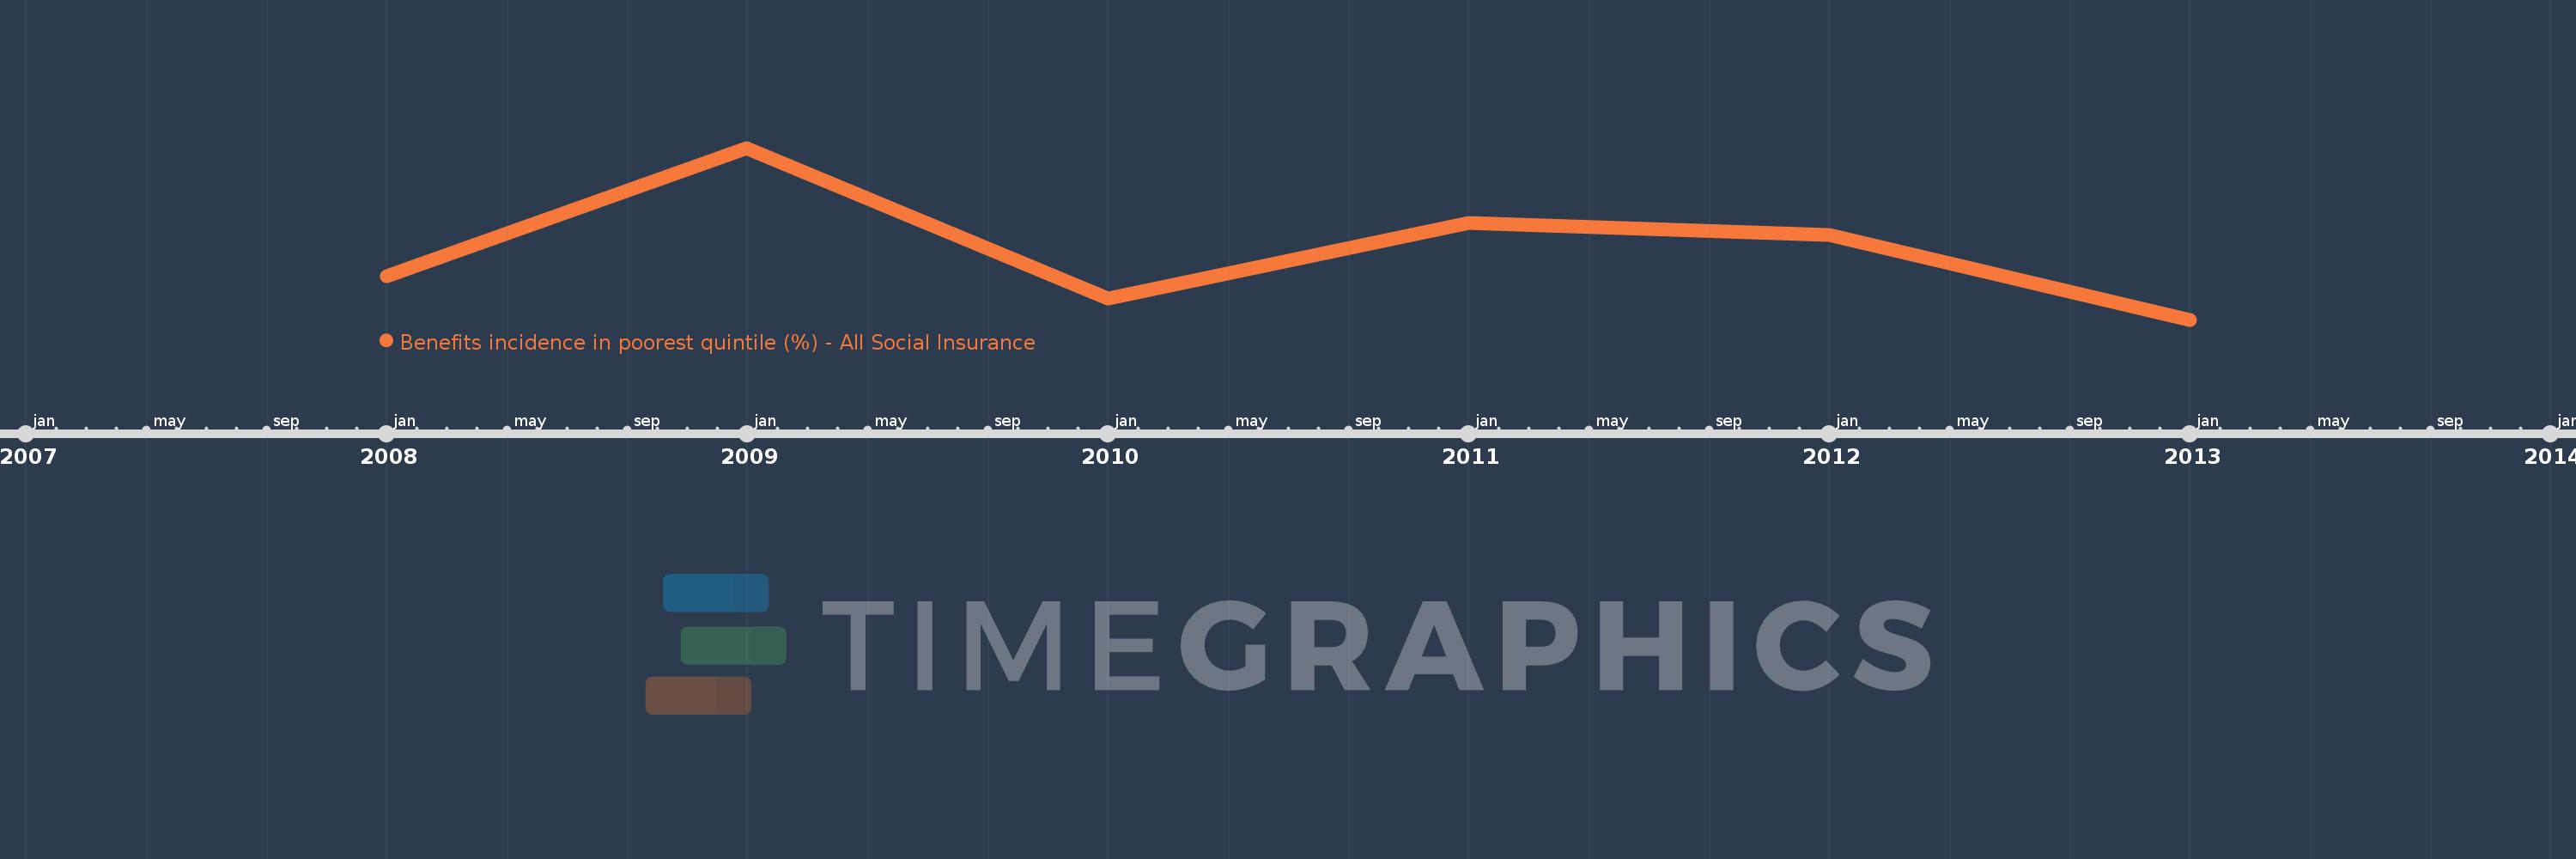
Benefits incidence in poorest quintile (%) - All Social Insurance
2013,2012,2011,2010,2009,2008
This statistics in other country:
Timeline:
This timeline shows a graph from 2008 to 2013 of Dominican Republic. No data until 2007. Number of actual observations by date: 6.
Source name:
World Development Indicators
Source organization:
The Atlas of Social Protection: Indicators of Resilience and Equity (ASPIRE)
Categories, topics:
Social Protection & Labor
Last updated:
apr 23, 2017
Indicators value changes by year
At the date of observation
Value
Absolute change
Change from previous value
jan 1, 2008
2.588
+2.588
0.0%
jan 1, 2009
3.766
+1.178
45.54%
jan 1, 2010
2.38
-1.385
-36.79%
jan 1, 2011
3.074
+0.694
29.14%
jan 1, 2012
2.964
-0.11
-3.59%
jan 1, 2013
2.188
-0.776
-26.19%
Ranking of countries by current statistics by years


Comments: