29
/
en
AIzaSyAYiBZKx7MnpbEhh9jyipgxe19OcubqV5w
April 1, 2024
268997
Turkey
TUR
true
2
1
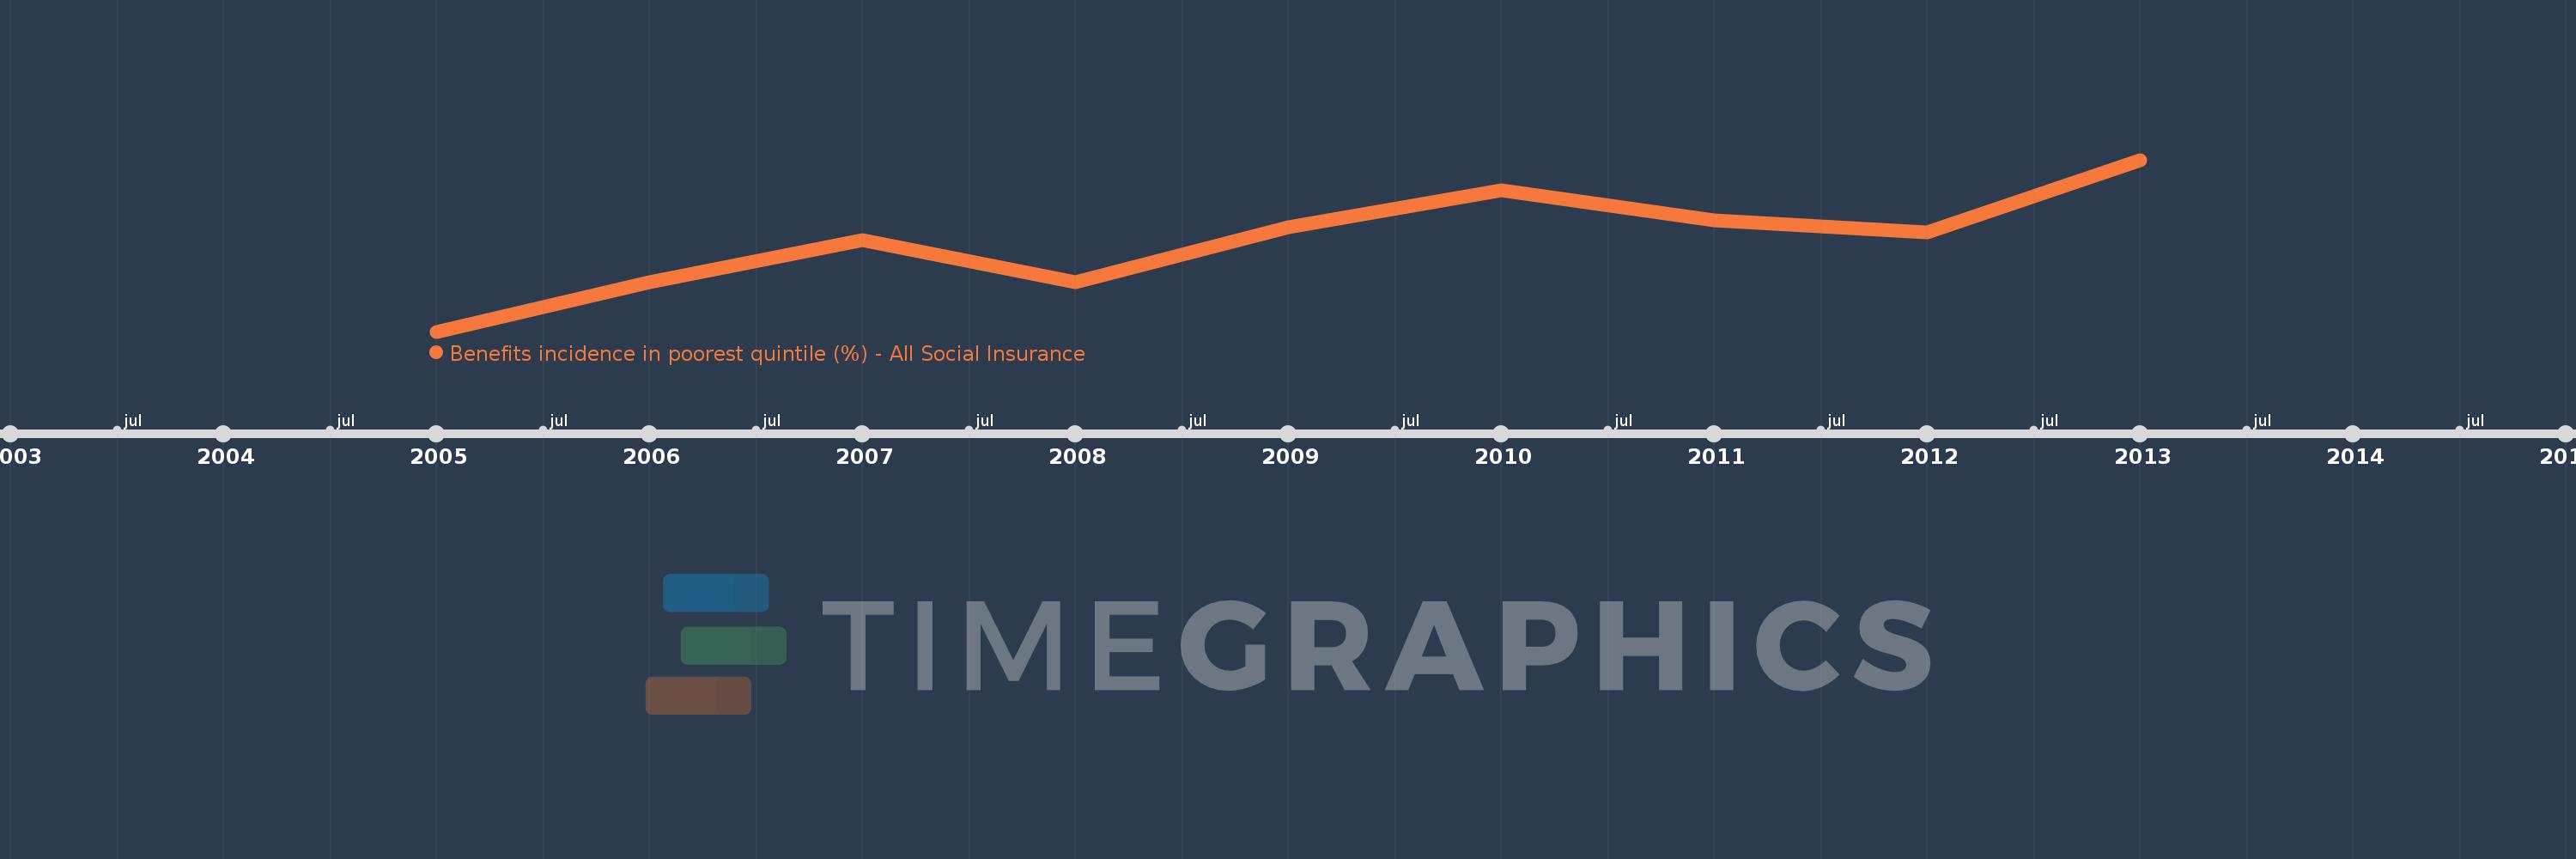
Benefits incidence in poorest quintile (%) - All Social Insurance
2013,2012,2011,2010,2009,2008,2007,2006,2005
This statistics in other country:
Timeline:
This timeline shows a graph from 2005 to 2013 of Turkey. No data until 2004. Number of actual observations by date: 9.
Source name:
World Development Indicators
Source organization:
The Atlas of Social Protection: Indicators of Resilience and Equity (ASPIRE)
Categories, topics:
Social Protection & Labor
Last updated:
apr 23, 2017
Indicators value changes by year
At the date of observation
Value
Absolute change
Change from previous value
jan 1, 2005
2.424
+2.424
0.0%
jan 1, 2006
3.199
+0.774
31.94%
jan 1, 2007
3.853
+0.654
20.45%
jan 1, 2008
3.199
-0.654
-16.98%
jan 1, 2009
4.065
+0.866
27.08%
jan 1, 2010
4.636
+0.571
14.06%
jan 1, 2011
4.166
-0.47
-10.14%
jan 1, 2012
3.977
-0.188
-4.52%
jan 1, 2013
5.12
+1.143
28.73%
Ranking of countries by current statistics by years


Comments: