Download This statistics in other country:
Timeline:
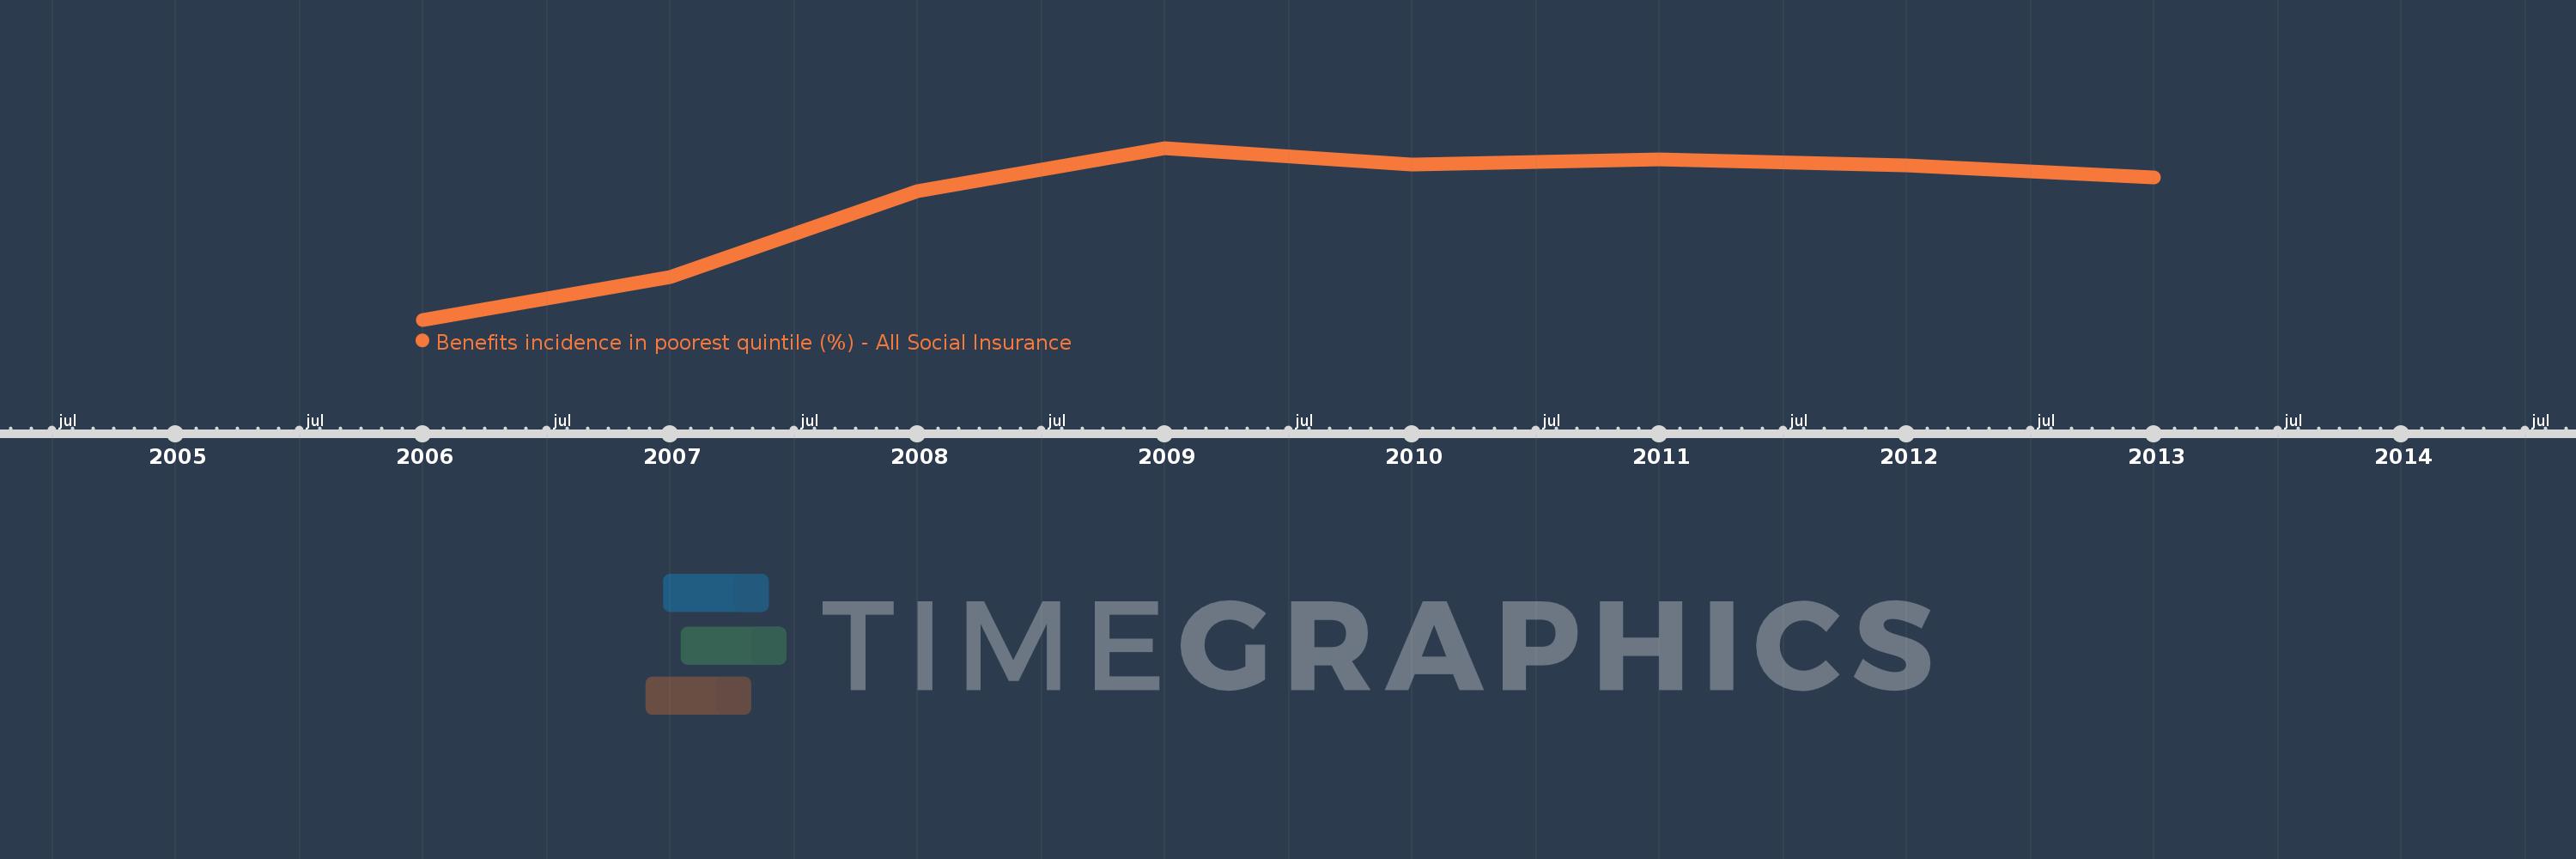
This timeline shows a graph from 2006 to 2013 of Poland. No data until 2005. Number of actual observations by date: 8.
Source name:
World Development Indicators
Source organization:
The Atlas of Social Protection: Indicators of Resilience and Equity (ASPIRE)
Categories, topics:
Social Protection & Labor
Last updated:
apr 23, 2017
Indicators value changes by year
At the date of observation
Value
Absolute change
Change from the previous value
jan 1, 2006
6.778
+6.778
0.0%
jan 1, 2007
7.281
+0.503
7.42%
jan 1, 2008
8.282
+1.001
13.74%
jan 1, 2009
8.785
+0.503
6.07%
jan 1, 2010
8.595
-0.19
-2.16%
jan 1, 2011
8.647
+0.052
0.6%
jan 1, 2012
8.581
-0.066
-0.76%
jan 1, 2013
8.439
-0.142
-1.66%
Ranking of countries by current statistics by years
