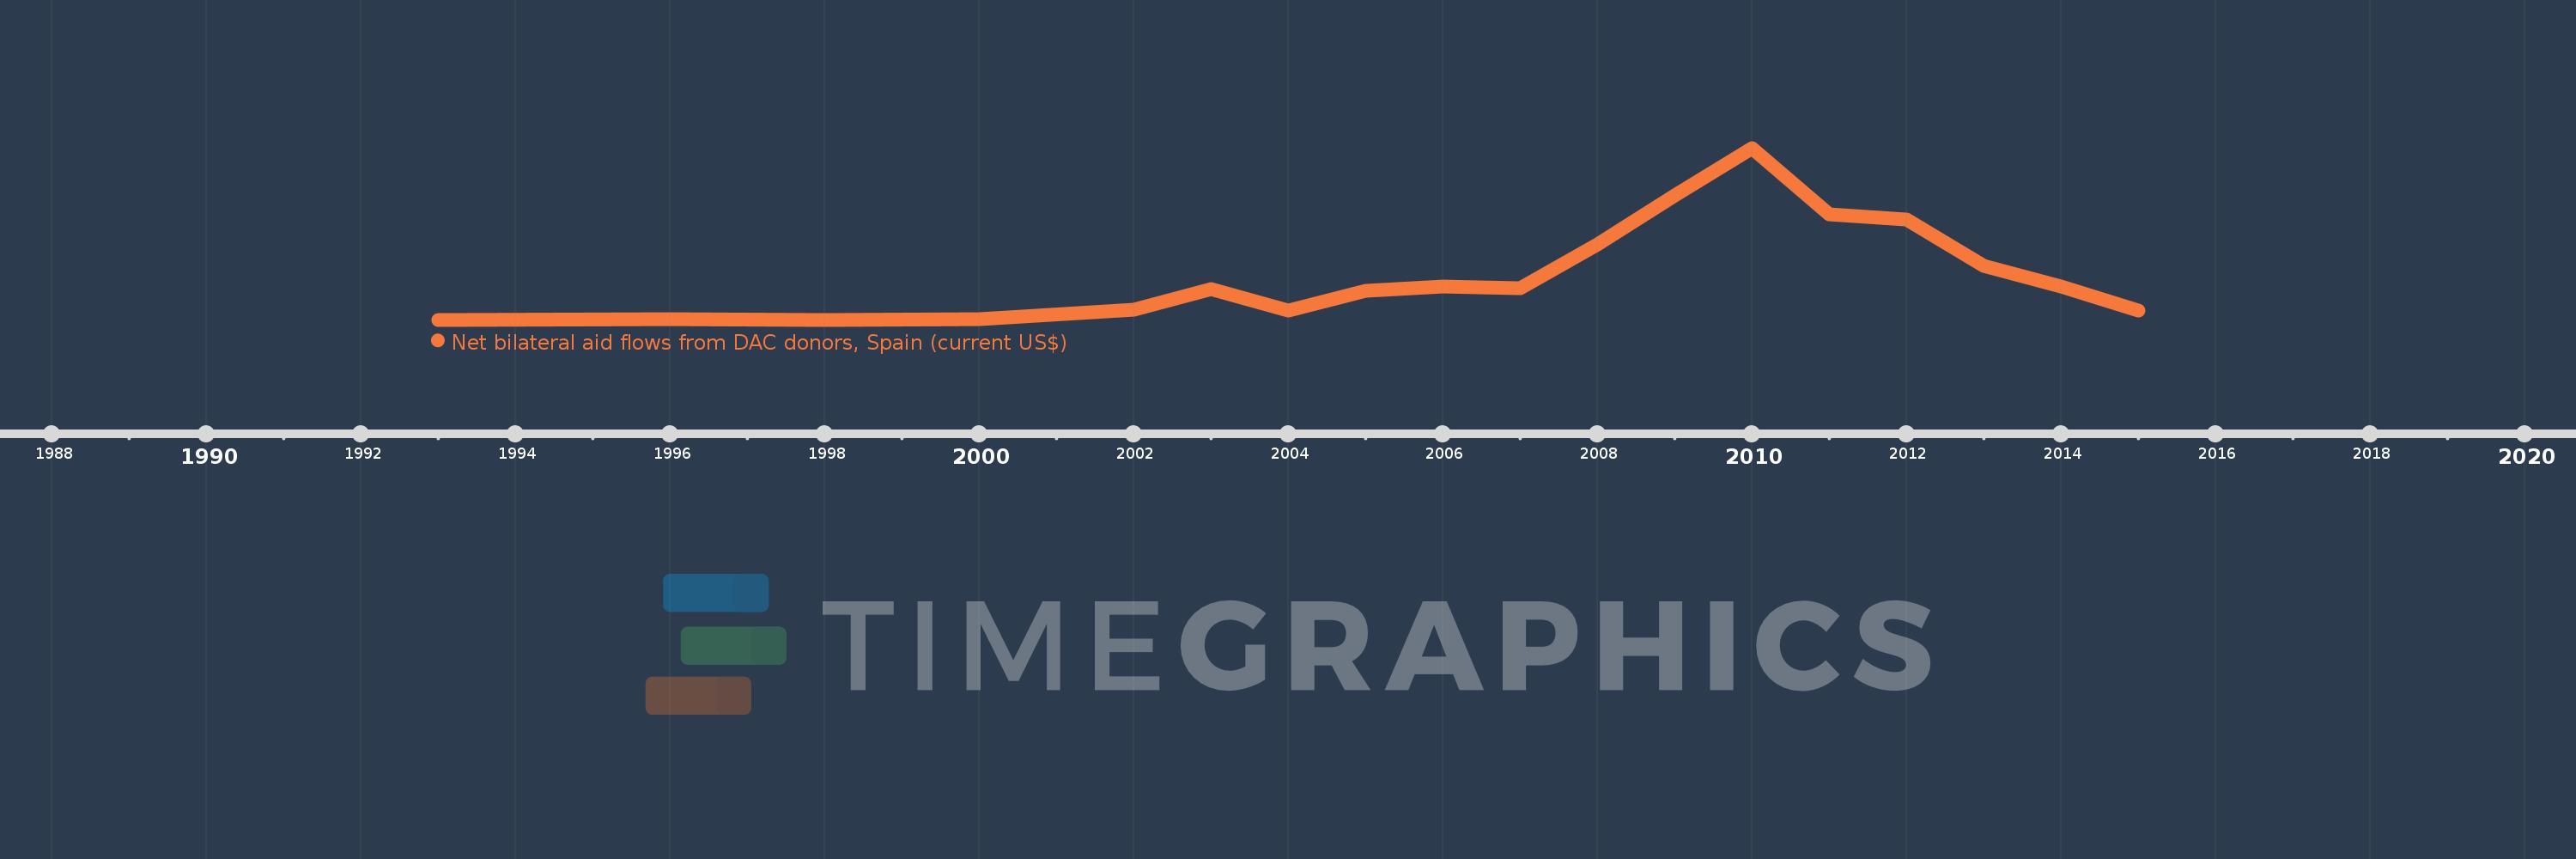
This timeline shows a graph from 1993 to 2015 of Afghanistan. No data until 1992. Number of actual observations by date: 18.
Source name:
World Development Indicators
Source organization:
Development Assistance Committee of the Organisation for Economic Co-operation and Development, Geographical Distribution of Financial Flows to Developing Countries, Development Co-operation Report, and International Development Statistics database. Data are available online at: www.oecd.org/dac/stats/idsonline.
Categories, topics:
Aid Effectiveness
Last updated:
apr 23, 2017
Indicators value changes by year
Meaning:
26.195 mln
Minimum:
20.0K
jan 1, 1993
Maximum:
98.91 mln
jan 1, 2010
At the date of observation
Value
Absolute change
Change from the previous value
jan 1, 1993
20.0K
+20.0K
0.0%
jan 1, 1996
120.0K
+100.0K
500.0%
jan 1, 1998
90.0K
-30.0K
-25.0%
jan 1, 2000
120.0K
+30.0K
33.33%
jan 1, 2002
5.92 mln
+5.8 mln
4.83K%
jan 1, 2003
17.81 mln
+11.89 mln
200.84%
jan 1, 2004
5.15 mln
-12.66 mln
-71.08%
jan 1, 2005
16.56 mln
+11.41 mln
221.55%
jan 1, 2006
19.0 mln
+2.44 mln
14.73%
jan 1, 2007
18.11 mln
-890.0K
-4.68%
jan 1, 2008
43.5 mln
+25.39 mln
140.2%
jan 1, 2009
71.79 mln
+28.29 mln
65.03%
jan 1, 2010
98.91 mln
+27.12 mln
37.78%
jan 1, 2011
60.83 mln
-38.08 mln
-38.5%
jan 1, 2012
57.62 mln
-3.21 mln
-5.28%
jan 1, 2013
31.19 mln
-26.43 mln
-45.87%
jan 1, 2014
19.23 mln
-11.96 mln
-38.35%
jan 1, 2015
5.54 mln
-13.69 mln
-71.19%
Ranking of countries by current statistics by years
