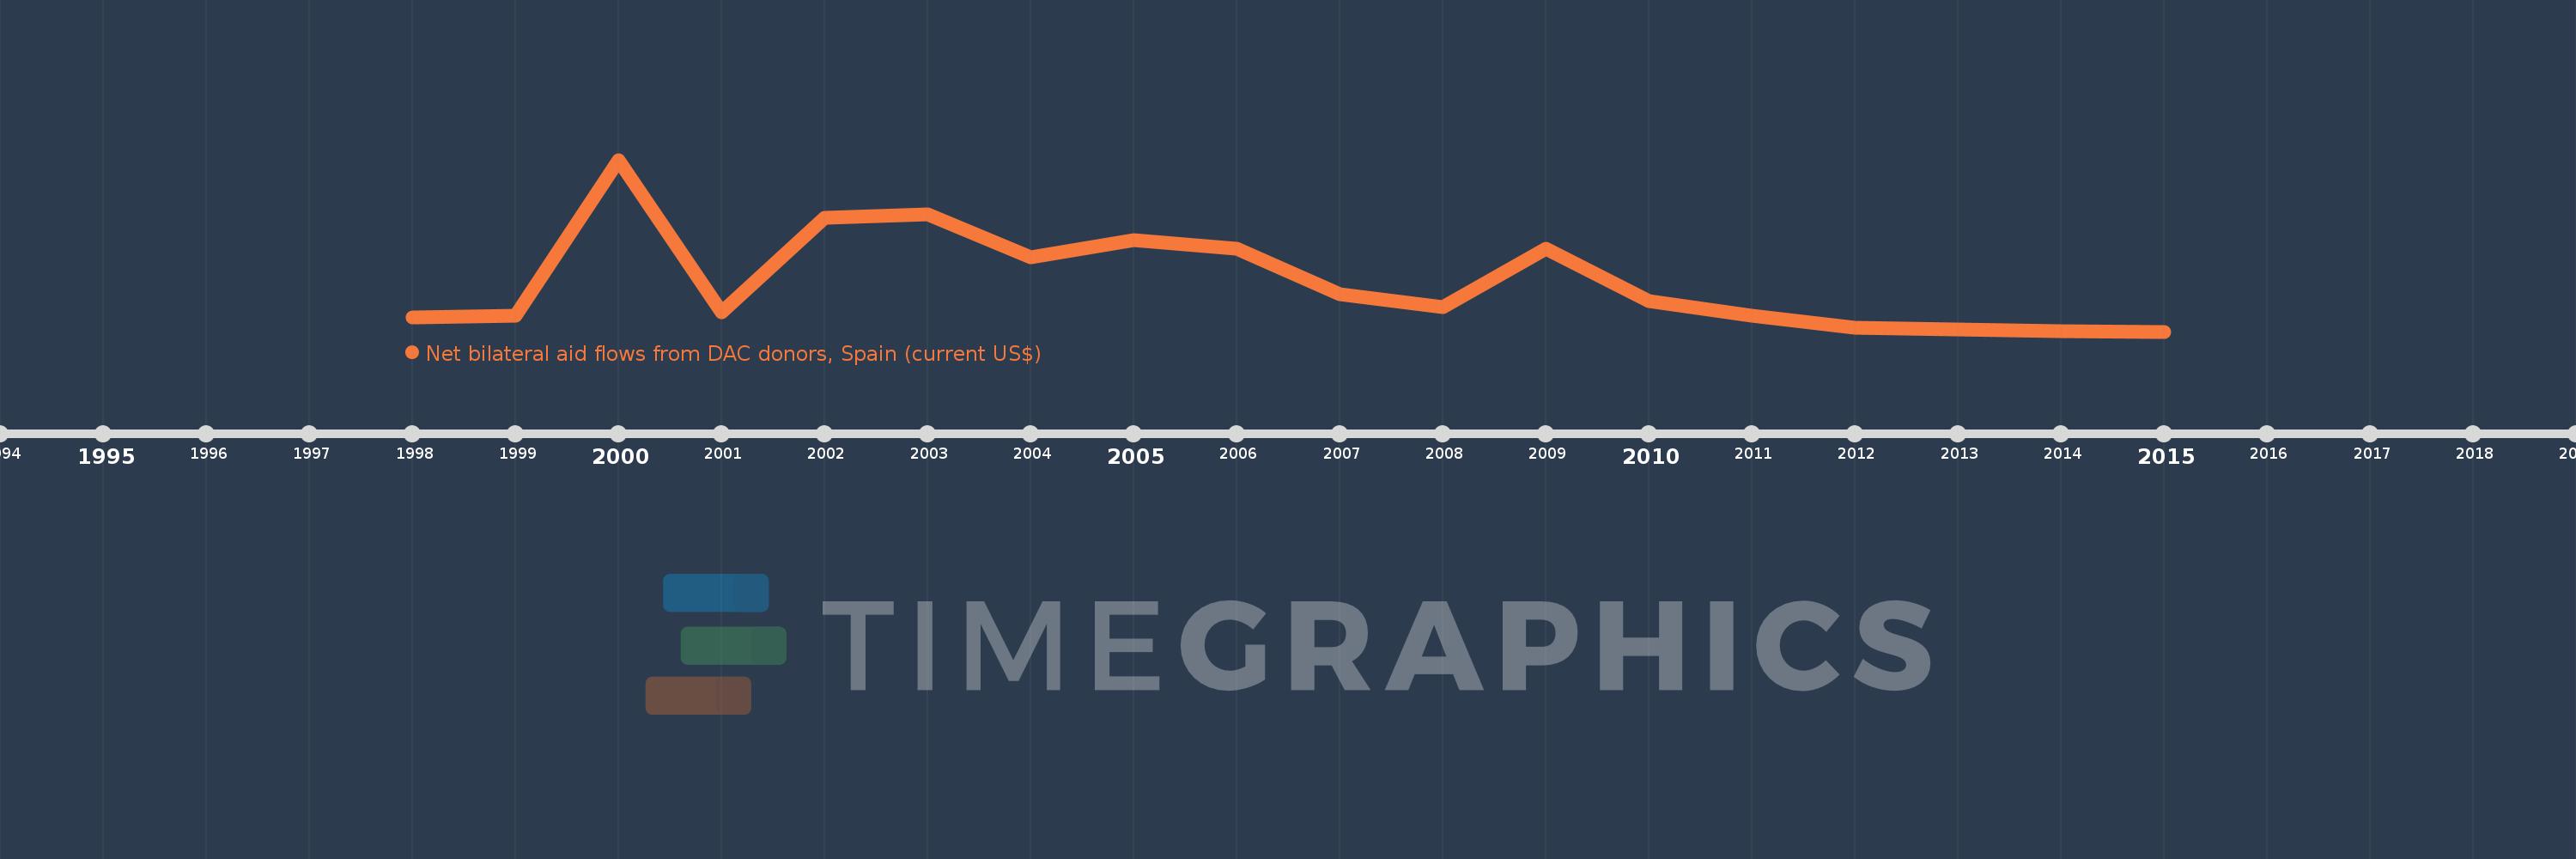
This timeline shows a graph from 1998 to 2015 of Serbia. No data until 1997. Number of actual observations by date: 18.
Source name:
World Development Indicators
Source organization:
Development Assistance Committee of the Organisation for Economic Co-operation and Development, Geographical Distribution of Financial Flows to Developing Countries, Development Co-operation Report, and International Development Statistics database. Data are available online at: www.oecd.org/dac/stats/idsonline.
Categories, topics:
Aid Effectiveness
Last updated:
apr 23, 2017
Indicators value changes by year
Meaning:
8.538 mln
Minimum:
-3.26 mln
jan 1, 2015
Maximum:
37.46 mln
jan 1, 2000
At the date of observation
Value
Absolute change
Change from the previous value
jan 1, 1998
60.0K
+60.0K
0.0%
jan 1, 1999
410.0K
+350.0K
583.33%
jan 1, 2000
37.46 mln
+37.05 mln
9.04K%
jan 1, 2001
1.3 mln
-36.16 mln
-96.53%
jan 1, 2002
23.79 mln
+22.49 mln
1.73K%
jan 1, 2003
24.47 mln
+680.0K
2.86%
jan 1, 2004
14.33 mln
-10.14 mln
-41.44%
jan 1, 2005
18.5 mln
+4.17 mln
29.1%
jan 1, 2006
16.29 mln
-2.21 mln
-11.95%
jan 1, 2007
5.51 mln
-10.78 mln
-66.18%
jan 1, 2008
2.48 mln
-3.03 mln
-54.99%
jan 1, 2009
16.31 mln
+13.83 mln
557.66%
jan 1, 2010
4.02 mln
-12.29 mln
-75.35%
jan 1, 2011
440.0K
-3.58 mln
-89.05%
jan 1, 2012
-2.38 mln
-2.82 mln
-640.91%
jan 1, 2013
-2.81 mln
-430.0K
18.07%
jan 1, 2014
-3.24 mln
-430.0K
15.3%
jan 1, 2015
-3.26 mln
-20.0K
0.62%
Ranking of countries by current statistics by years
