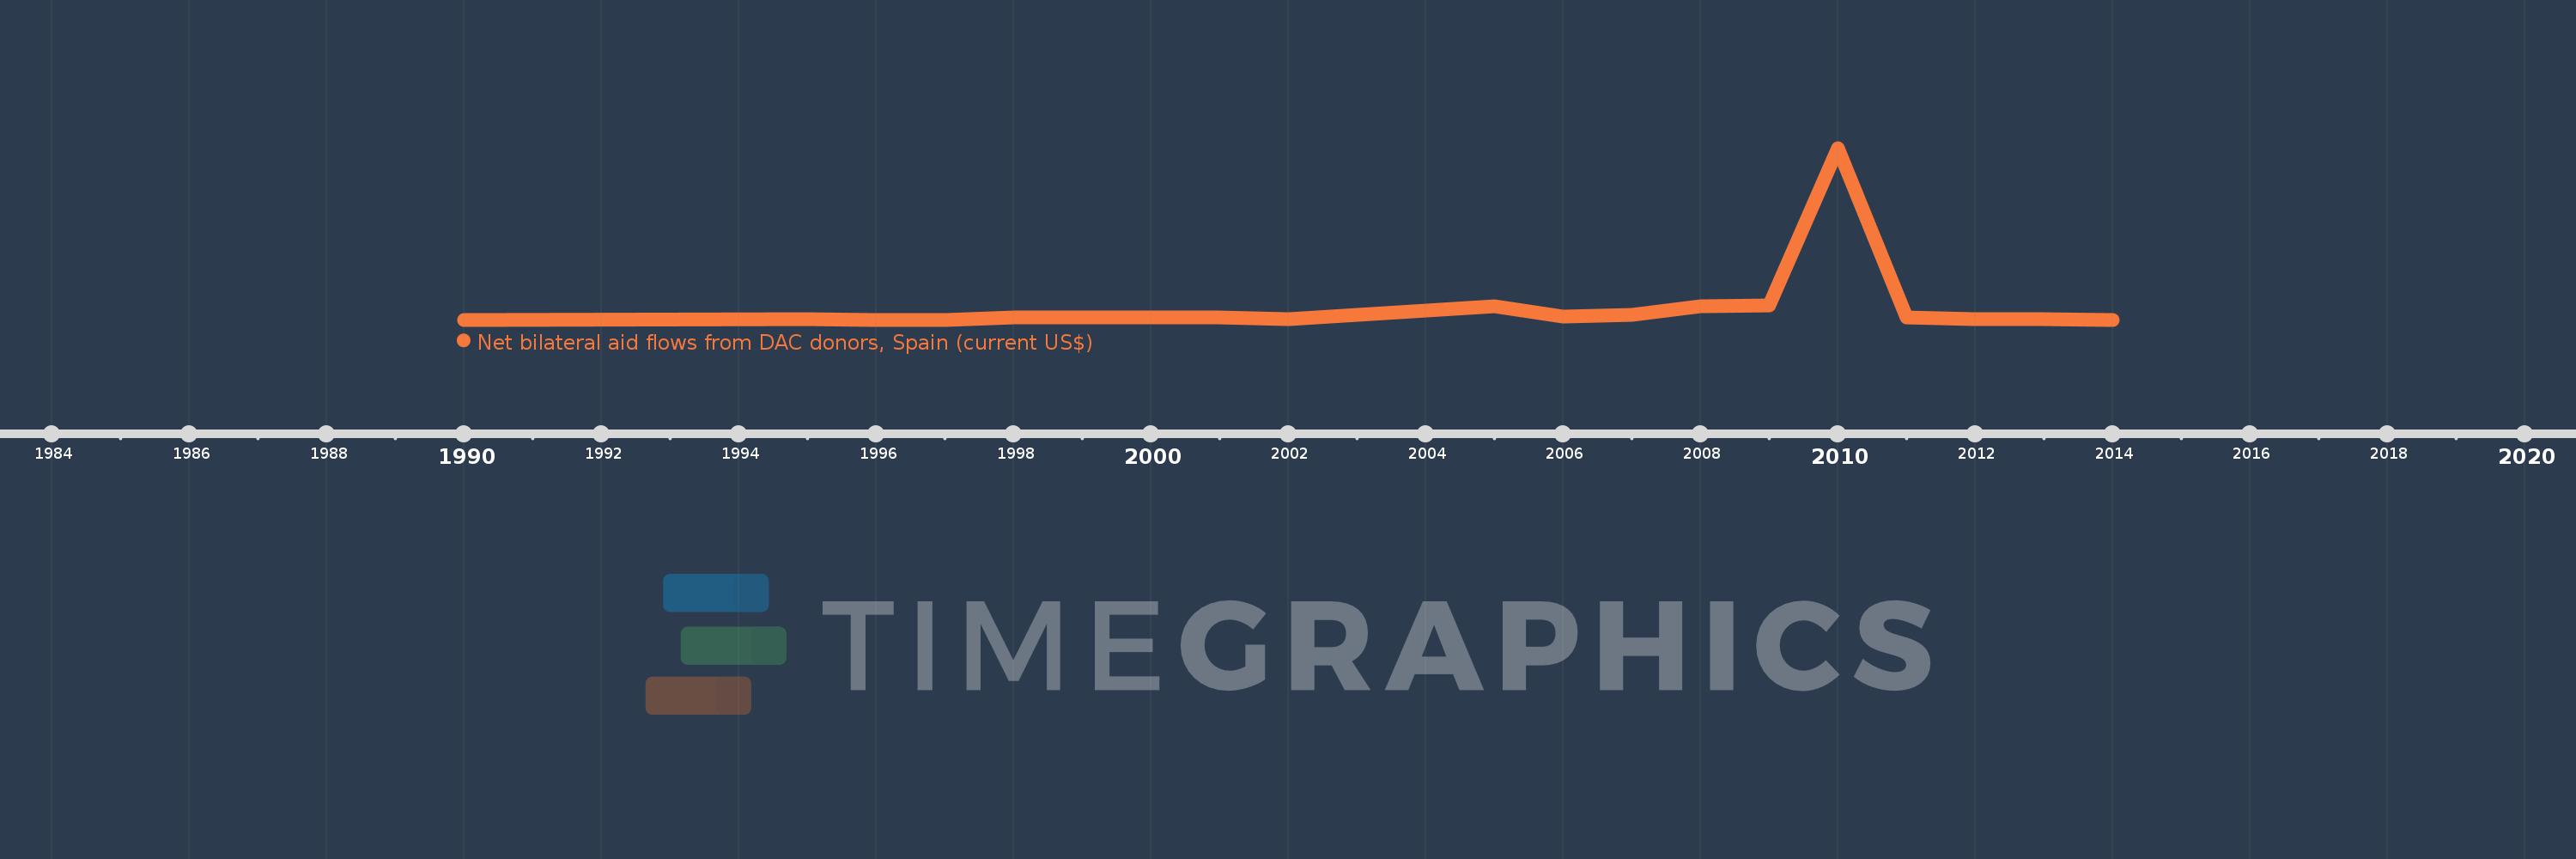
This timeline shows a graph from 1990 to 2014 of Zambia. No data until 1989. Number of actual observations by date: 19.
Source name:
World Development Indicators
Source organization:
Development Assistance Committee of the Organisation for Economic Co-operation and Development, Geographical Distribution of Financial Flows to Developing Countries, Development Co-operation Report, and International Development Statistics database. Data are available online at: www.oecd.org/dac/stats/idsonline.
Categories, topics:
Aid Effectiveness
Last updated:
apr 23, 2017
Indicators value changes by year
Meaning:
857.895K
Minimum:
10.0K
jan 1, 1990
Maximum:
11.8 mln
jan 1, 2010
At the date of observation
Value
Absolute change
Change from the previous value
jan 1, 1990
10.0K
+10.0K
0.0%
jan 1, 1995
60.0K
+50.0K
500.0%
jan 1, 1996
20.0K
-40.0K
-66.67%
jan 1, 1997
20.0K
0.0
0.0%
jan 1, 1998
170.0K
+150.0K
750.0%
jan 1, 1999
160.0K
-10.0K
-5.88%
jan 1, 2000
150.0K
-10.0K
-6.25%
jan 1, 2001
140.0K
-10.0K
-6.67%
jan 1, 2002
80.0K
-60.0K
-42.86%
jan 1, 2005
940.0K
+860.0K
1.07K%
jan 1, 2006
200.0K
-740.0K
-78.72%
jan 1, 2007
350.0K
+150.0K
75.0%
jan 1, 2008
930.0K
+580.0K
165.71%
jan 1, 2009
1000.0K
+70.0K
7.53%
jan 1, 2010
11.8 mln
+10.8 mln
1.08K%
jan 1, 2011
160.0K
-11.64 mln
-98.64%
jan 1, 2012
60.0K
-100.0K
-62.5%
jan 1, 2013
40.0K
-20.0K
-33.33%
jan 1, 2014
10.0K
-30.0K
-75.0%
Ranking of countries by current statistics by years
