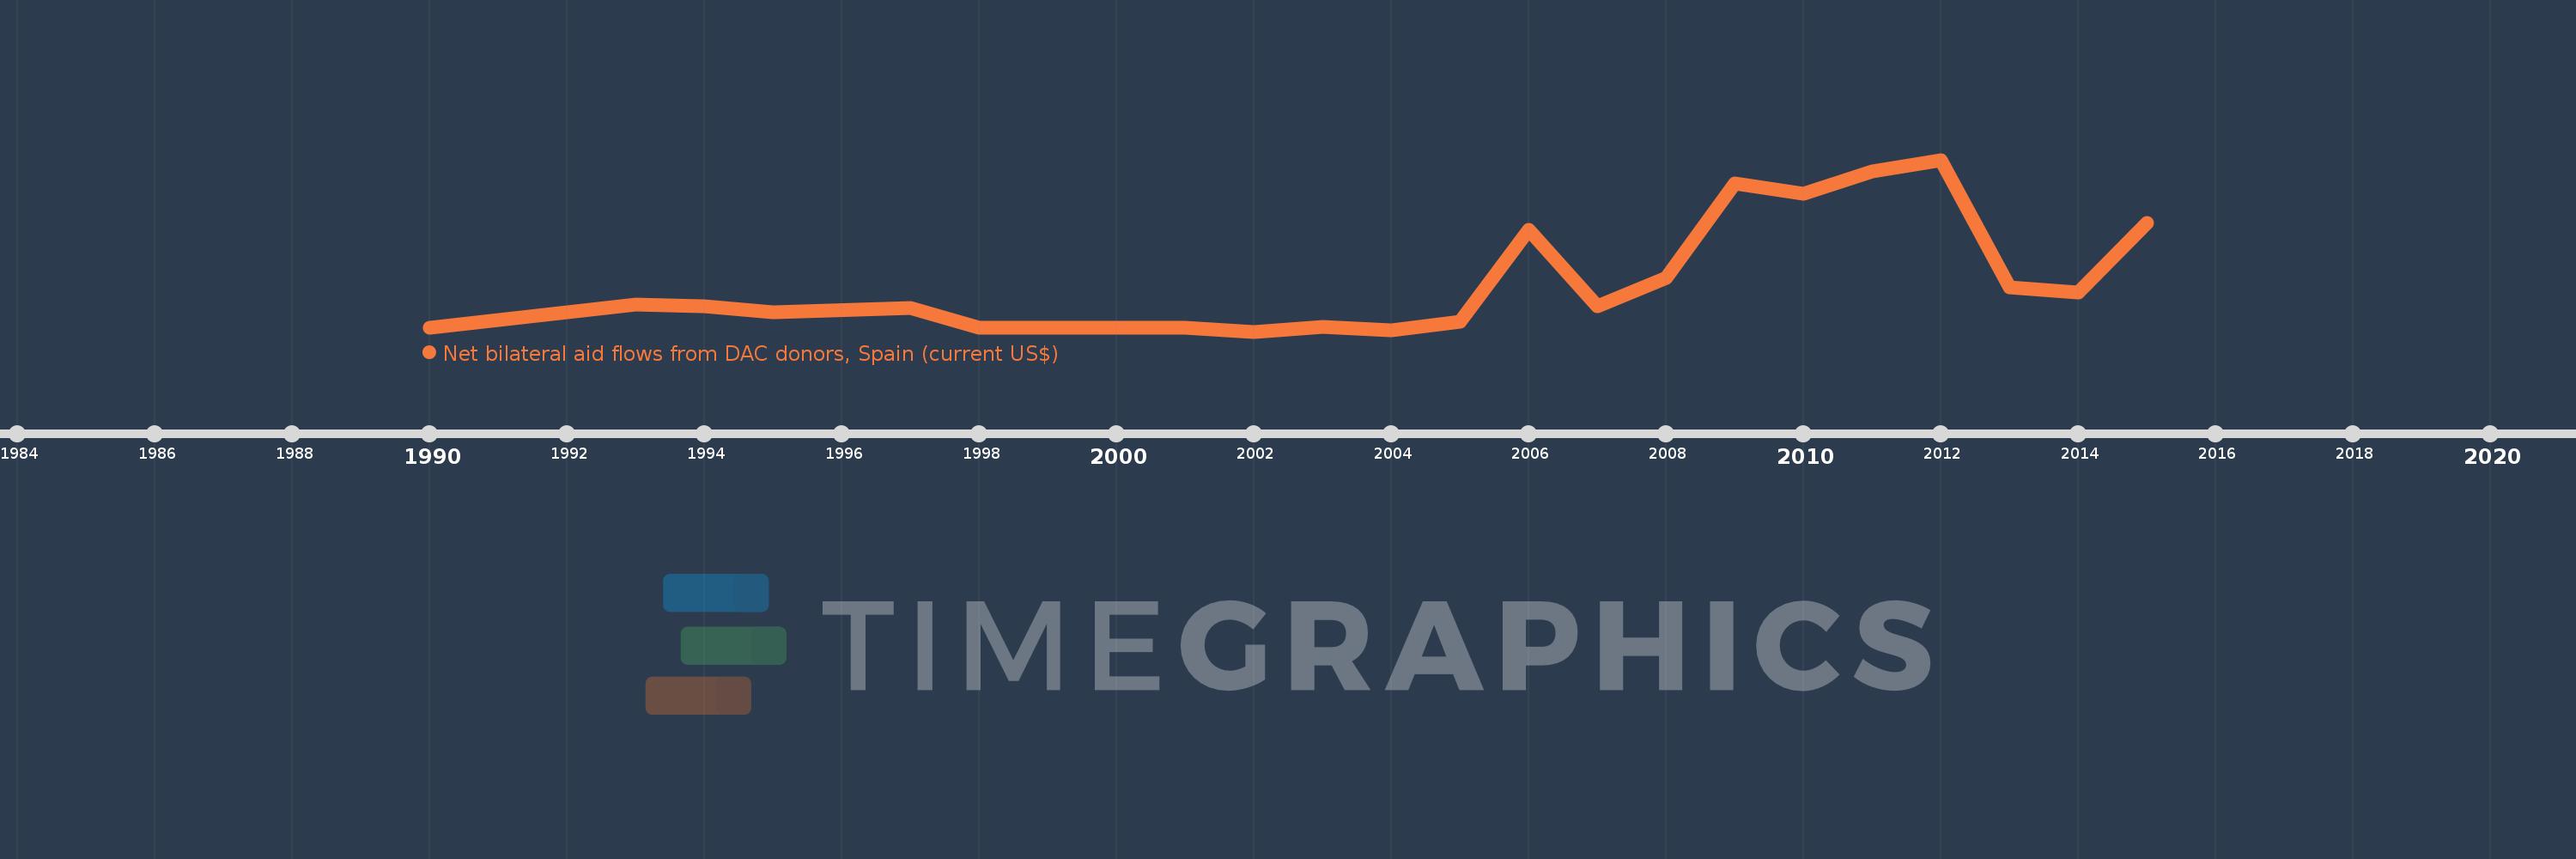
This timeline shows a graph from 1990 to 2015 of Niger. No data until 1989. Number of actual observations by date: 23.
Source name:
World Development Indicators
Source organization:
Development Assistance Committee of the Organisation for Economic Co-operation and Development, Geographical Distribution of Financial Flows to Developing Countries, Development Co-operation Report, and International Development Statistics database. Data are available online at: www.oecd.org/dac/stats/idsonline.
Categories, topics:
Aid Effectiveness
Last updated:
apr 23, 2017
Indicators value changes by year
Meaning:
7.44 mln
Minimum:
-640.0K
jan 1, 2002
Maximum:
27.84 mln
jan 1, 2012
At the date of observation
Value
Absolute change
Change from the previous value
jan 1, 1990
10.0K
+10.0K
0.0%
jan 1, 1993
3.86 mln
+3.85 mln
38.5K%
jan 1, 1994
3.5 mln
-360.0K
-9.33%
jan 1, 1995
2.51 mln
-990.0K
-28.29%
jan 1, 1997
3.26 mln
+750.0K
29.88%
jan 1, 1998
70.0K
-3.19 mln
-97.85%
jan 1, 1999
20.0K
-50.0K
-71.43%
jan 1, 2000
40.0K
+20.0K
100.0%
jan 1, 2001
30.0K
-10.0K
-25.0%
jan 1, 2002
-640.0K
-670.0K
-2.23K%
jan 1, 2003
160.0K
+800.0K
-125.0%
jan 1, 2004
-450.0K
-610.0K
-381.25%
jan 1, 2005
1.02 mln
+1.47 mln
-326.67%
jan 1, 2006
16.17 mln
+15.15 mln
1.49K%
jan 1, 2007
3.49 mln
-12.68 mln
-78.42%
jan 1, 2008
8.19 mln
+4.7 mln
134.67%
jan 1, 2009
23.98 mln
+15.79 mln
192.8%
jan 1, 2010
22.2 mln
-1.78 mln
-7.42%
jan 1, 2011
25.87 mln
+3.67 mln
16.53%
jan 1, 2012
27.84 mln
+1.97 mln
7.61%
jan 1, 2013
6.68 mln
-21.16 mln
-76.01%
jan 1, 2014
5.88 mln
-800.0K
-11.98%
jan 1, 2015
17.44 mln
+11.56 mln
196.6%
Ranking of countries by current statistics by years
