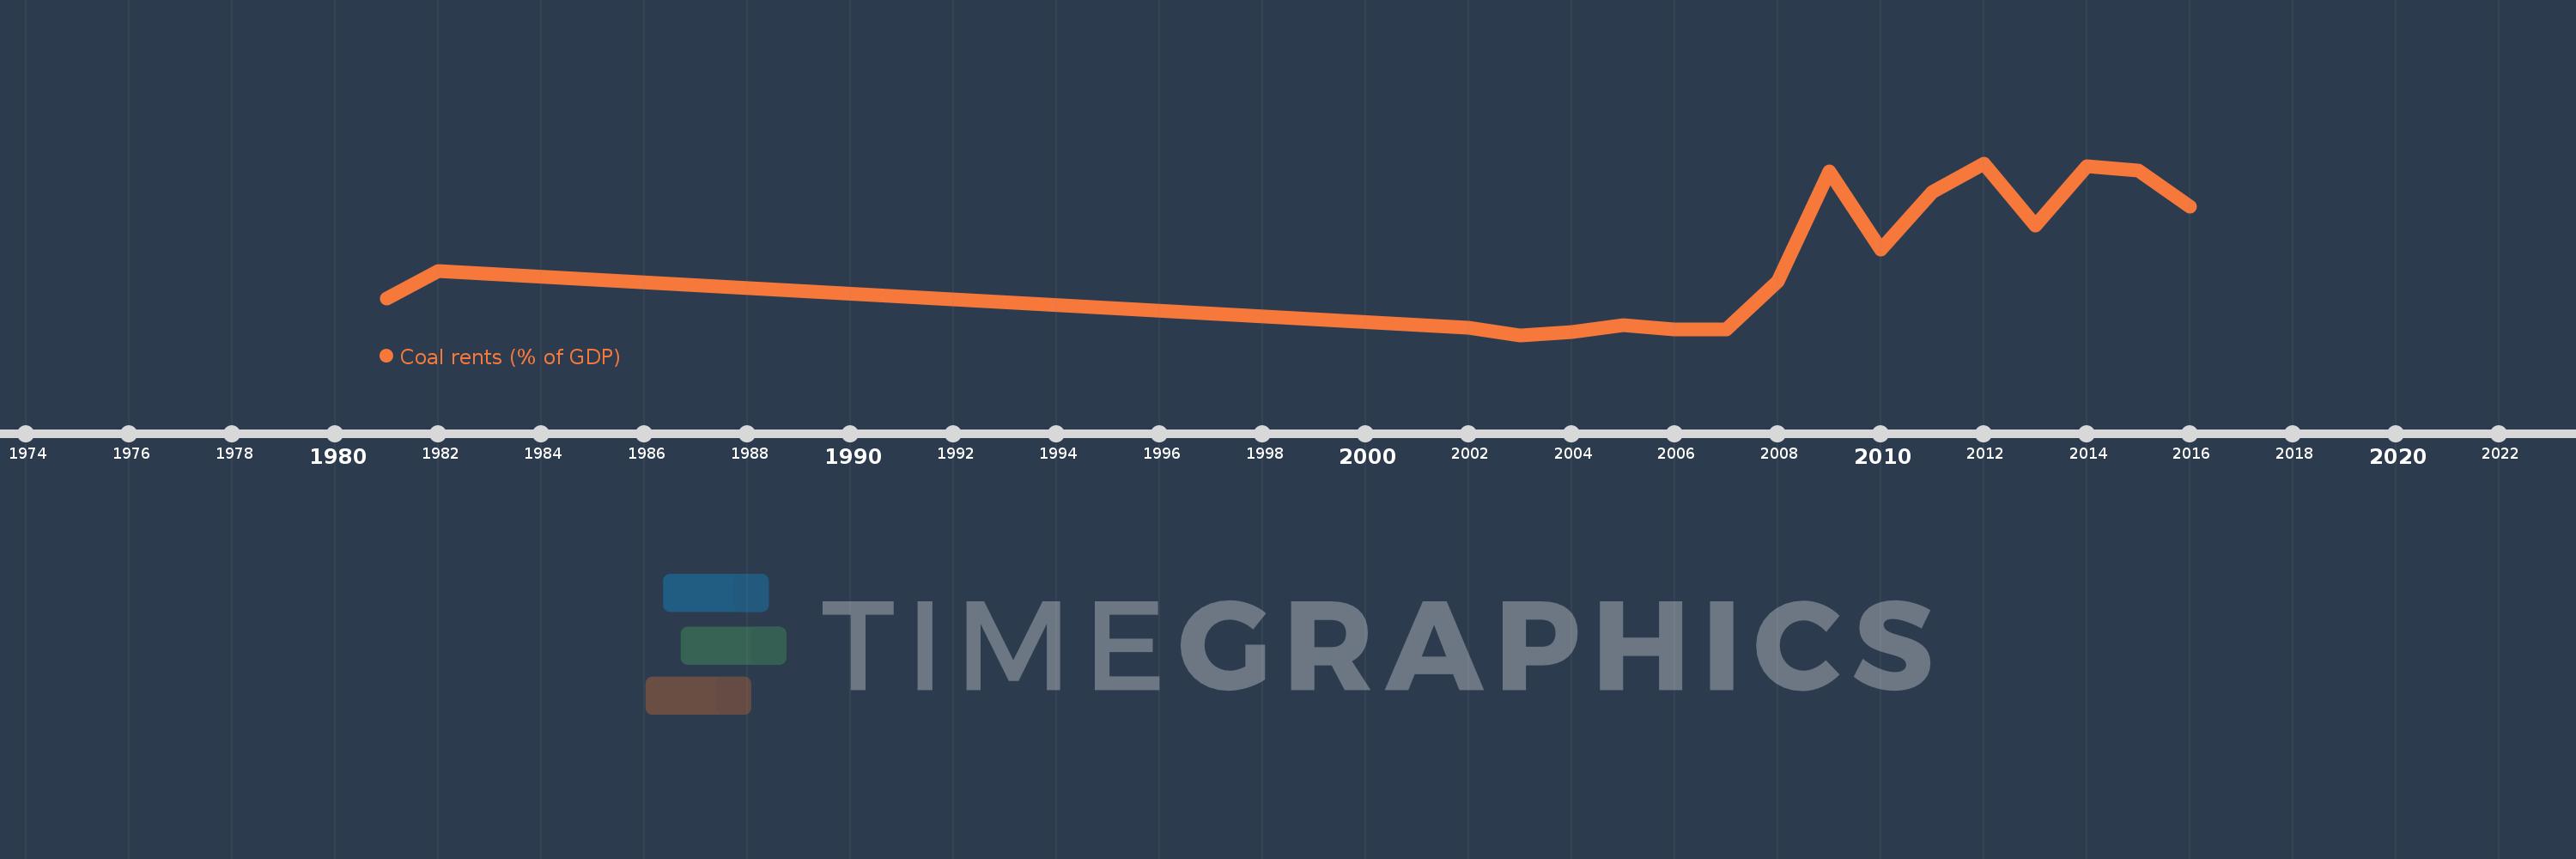
This timeline shows a graph from 1981 to 2016 of Afghanistan. No data until 1980. Number of actual observations by date: 17.
Source name:
World Development Indicators
Source organization:
Estimates based on sources and methods described in "The Changing Wealth of Nations: Measuring Sustainable Development in the New Millennium" (World Bank, 2011).
Categories, topics:
Environment
Last updated:
apr 23, 2017
Indicators value changes by year
Meaning:
0.105
Minimum:
0.004
jan 1, 2003
Maximum:
0.228
jan 1, 2012
At the date of observation
Value
Absolute change
Change from the previous value
jan 1, 1981
0.052
+0.052
0.0%
jan 1, 1982
0.087
+0.036
68.93%
jan 1, 2002
0.013
-0.074
-84.66%
jan 1, 2003
0.004
-0.009
-67.26%
jan 1, 2004
0.008
+0.003
79.93%
jan 1, 2005
0.017
+0.009
113.94%
jan 1, 2006
0.011
-0.006
-34.45%
jan 1, 2007
0.011
0.0
-0.7%
jan 1, 2008
0.074
+0.063
573.34%
jan 1, 2009
0.217
+0.143
194.44%
jan 1, 2010
0.115
-0.102
-46.88%
jan 1, 2011
0.19
+0.075
65.08%
jan 1, 2012
0.228
+0.038
19.92%
jan 1, 2013
0.147
-0.081
-35.41%
jan 1, 2014
0.224
+0.076
51.83%
jan 1, 2015
0.219
-0.005
-2.09%
jan 1, 2016
0.172
-0.047
-21.37%
Ranking of countries by current statistics by years
