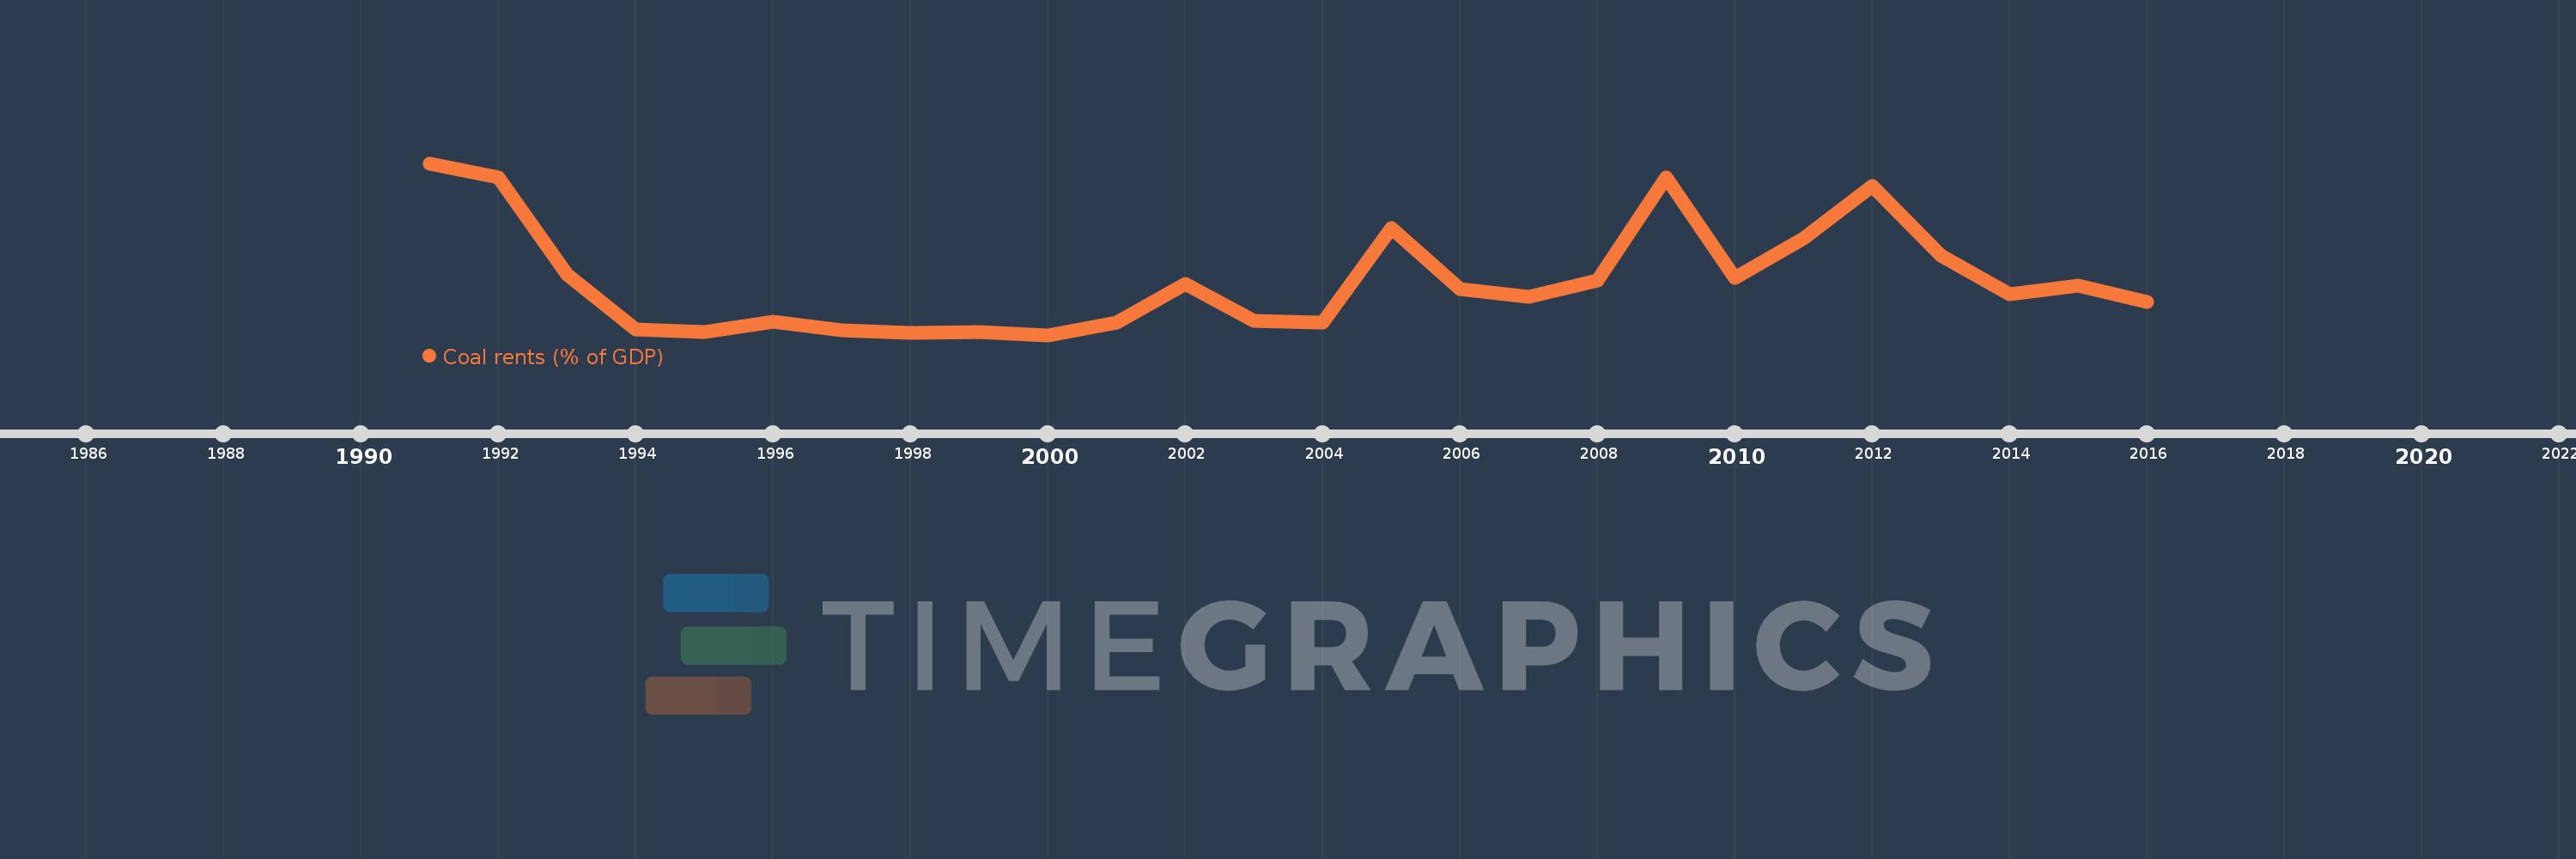
This timeline shows a graph from 1991 to 2016 of Kyrgyz Republic. No data until 1990. Number of actual observations by date: 26.
Source name:
World Development Indicators
Source organization:
Estimates based on sources and methods described in "The Changing Wealth of Nations: Measuring Sustainable Development in the New Millennium" (World Bank, 2011).
Categories, topics:
Environment
Last updated:
apr 23, 2017
Indicators value changes by year
Meaning:
0.147
Minimum:
0.003
jan 1, 2000
Maximum:
0.456
jan 1, 1991
At the date of observation
Value
Absolute change
Change from the previous value
jan 1, 1991
0.456
+0.456
0.0%
jan 1, 1992
0.418
-0.038
-8.35%
jan 1, 1993
0.162
-0.255
-61.11%
jan 1, 1994
0.017
-0.145
-89.48%
jan 1, 1995
0.012
-0.005
-27.73%
jan 1, 1996
0.037
+0.024
197.19%
jan 1, 1997
0.016
-0.021
-57.14%
jan 1, 1998
0.009
-0.007
-42.86%
jan 1, 1999
0.012
+0.003
29.79%
jan 1, 2000
0.003
-0.008
-72.46%
jan 1, 2001
0.035
+0.031
978.7%
jan 1, 2002
0.137
+0.102
293.99%
jan 1, 2003
0.04
-0.097
-70.87%
jan 1, 2004
0.035
-0.005
-11.92%
jan 1, 2005
0.286
+0.251
717.42%
jan 1, 2006
0.125
-0.162
-56.47%
jan 1, 2007
0.103
-0.021
-17.2%
jan 1, 2008
0.147
+0.044
42.55%
jan 1, 2009
0.419
+0.272
184.59%
jan 1, 2010
0.153
-0.266
-63.51%
jan 1, 2011
0.258
+0.105
68.69%
jan 1, 2012
0.395
+0.137
53.03%
jan 1, 2013
0.213
-0.182
-46.11%
jan 1, 2014
0.111
-0.102
-48.02%
jan 1, 2015
0.134
+0.024
21.56%
jan 1, 2016
0.09
-0.044
-32.68%
Ranking of countries by current statistics by years
