29
/
en
AIzaSyAYiBZKx7MnpbEhh9jyipgxe19OcubqV5w
April 1, 2024
62451
World
WLD
false
2
1
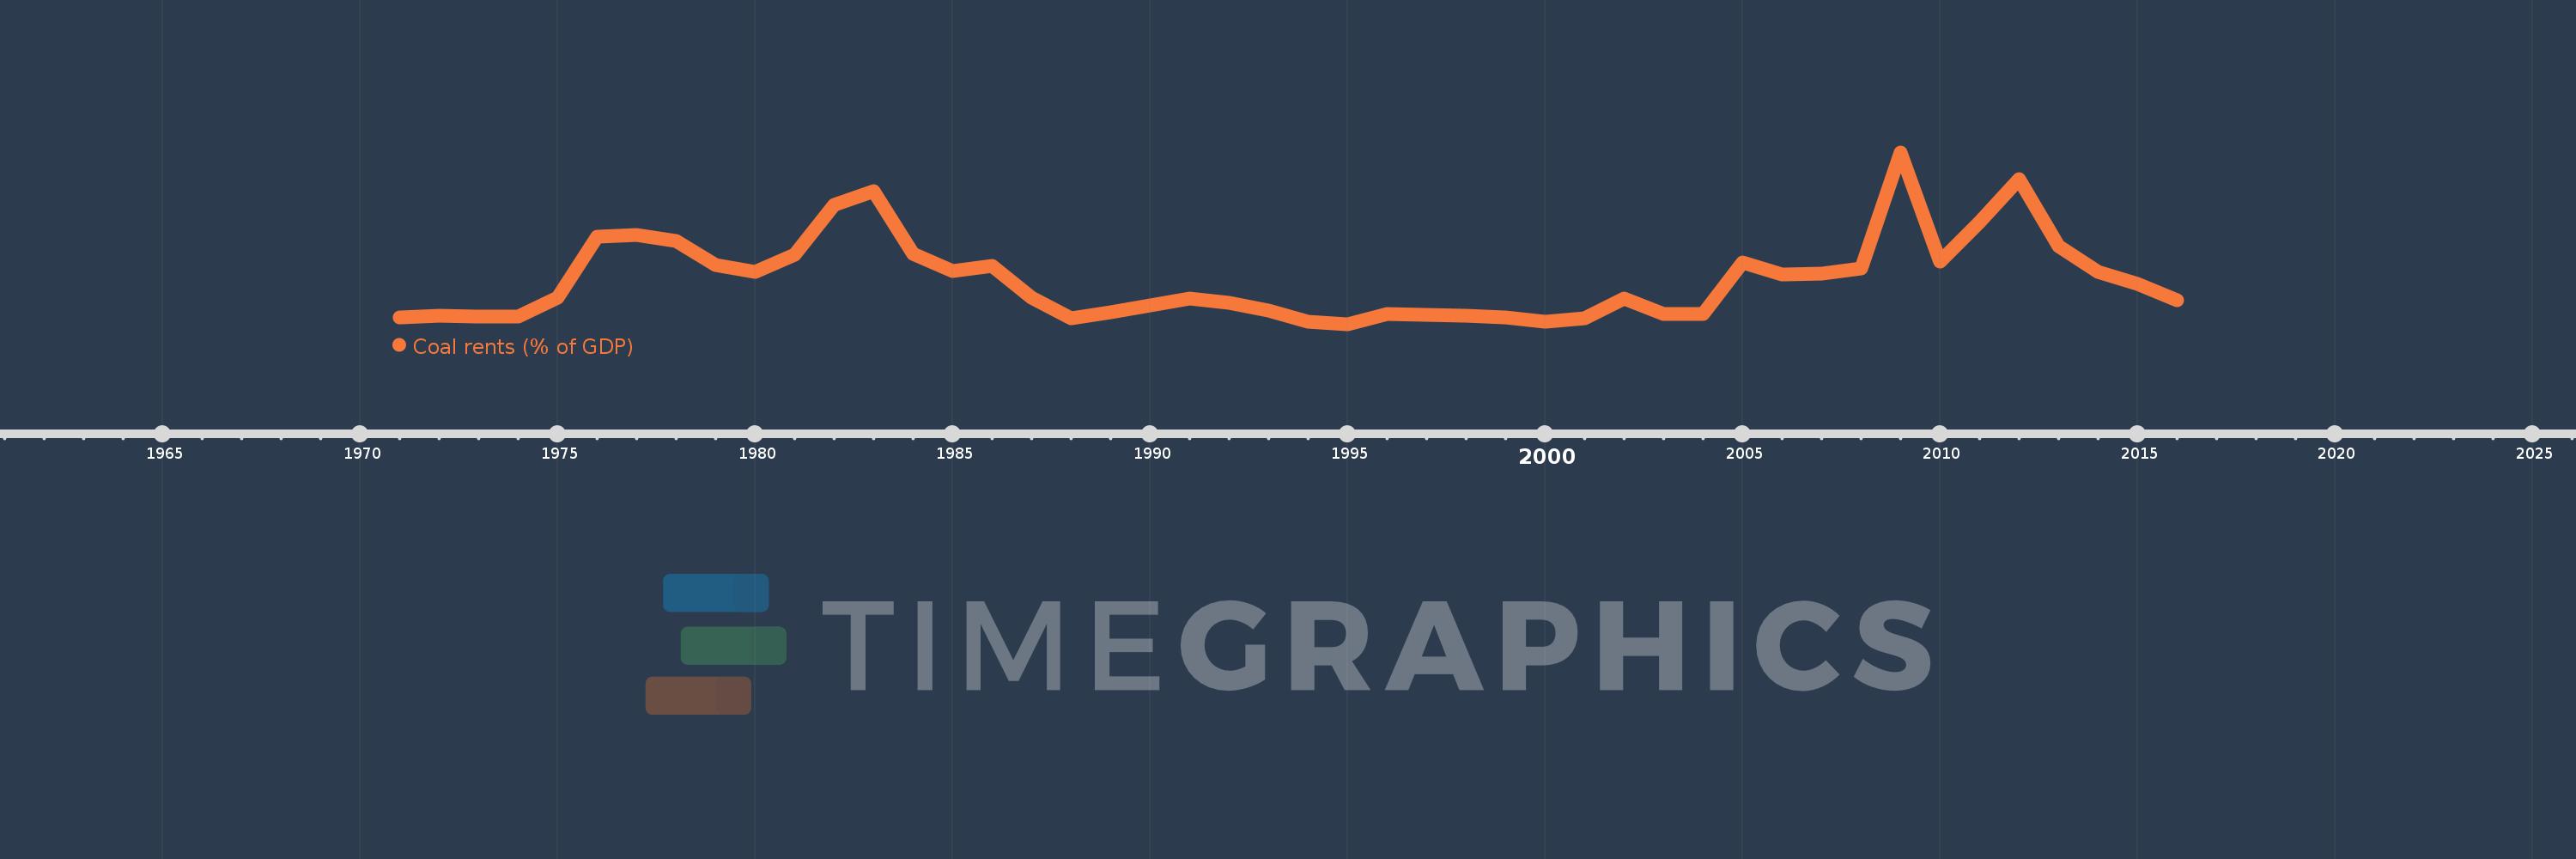
Coal rents (% of GDP)
2016,2015,2014,2013,2012,2011,2010,2009,2008,2007,2006,2005,2004,2003,2002,2001,2000,1999,1998,1997,1996,1995,1994,1993,1992,1991,1990,1989,1988,1987,1986,1985,1984,1983,1982,1981,1980,1979,1978,1977,1976,1975,1974,1973,1972,1971
This statistics in other country:
AfghanistanAlbaniaAlgeriaAngolaAntigua and BarbudaArab WorldArgentinaArmeniaArubaAustraliaAustriaAzerbaijanBahamas, TheBahrainBangladeshBarbadosBelarusBelgiumBelizeBeninBermudaBhutanBoliviaBosnia and HerzegovinaBotswanaBrazilBrunei DarussalamBulgariaBurkina FasoBurundiCabo VerdeCambodiaCameroonCanadaCaribbean small statesCayman IslandsCentral African RepublicCentral Europe and the BalticsChadChileChinaColombiaComorosCongo, Dem. Rep.Congo, Rep.Costa RicaCote d'IvoireCroatiaCubaCyprusCzech RepublicDenmarkDjiboutiDominicaDominican RepublicEarly-demographic dividendEast Asia & PacificEast Asia & Pacific (excluding high income)East Asia & Pacific (IDA & IBRD countries)EcuadorEgypt, Arab Rep.El SalvadorEquatorial GuineaEritreaEstoniaEthiopiaEuro areaEurope & Central AsiaEurope & Central Asia (excluding high income)Europe & Central Asia (IDA & IBRD countries)European UnionFijiFinlandFragile and conflict affected situationsFranceFrench PolynesiaGabonGambia, TheGeorgiaGermanyGhanaGreeceGreenlandGrenadaGuatemalaGuineaGuinea-BissauGuyanaHaitiHeavily indebted poor countries (HIPC)High incomeHondurasHong Kong SAR, ChinaHungaryIBRD onlyIcelandIDA & IBRD totalIDA blendIDA onlyIDA totalIndiaIndonesiaIran, Islamic Rep.IraqIrelandIsraelItalyJamaicaJapanJordanKazakhstanKenyaKiribatiKorea, Rep.KosovoKuwaitKyrgyz RepublicLao PDRLate-demographic dividendLatin America & Caribbean Latin America & Caribbean (excluding high income)Latin America & the Caribbean (IDA & IBRD countries)LatviaLeast developed countries: UN classificationLebanonLesothoLiberiaLibyaLithuaniaLow & middle incomeLow incomeLower middle incomeLuxembourgMacao SAR, ChinaMacedonia, FYRMadagascarMalawiMalaysiaMaldivesMaliMaltaMauritaniaMauritiusMexicoMiddle East & North AfricaMiddle East & North Africa (excluding high income)Middle East & North Africa (IDA & IBRD countries)Middle incomeMoldovaMongoliaMontenegroMoroccoMozambiqueMyanmarNamibiaNepalNetherlandsNew CaledoniaNew ZealandNicaraguaNigerNigeriaNorth AmericaNorwayOECD membersOmanOther small statesPacific island small statesPakistanPanamaPapua New GuineaParaguayPeruPhilippinesPolandPortugalPost-demographic dividendPre-demographic dividendPuerto RicoQatarRomaniaRussian FederationRwandaSamoaSao Tome and PrincipeSaudi ArabiaSenegalSerbiaSeychellesSierra LeoneSingaporeSlovak RepublicSloveniaSmall statesSolomon IslandsSouth AfricaSouth AsiaSouth Asia (IDA & IBRD)SpainSri LankaSt. Kitts and NevisSt. LuciaSt. Vincent and the GrenadinesSub-Saharan Africa Sub-Saharan Africa (excluding high income)Sub-Saharan Africa (IDA & IBRD countries)SudanSurinameSwazilandSwedenSwitzerlandSyrian Arab RepublicTajikistanTanzaniaThailandTimor-LesteTogoTongaTrinidad and TobagoTunisiaTurkeyTurkmenistanUgandaUkraineUnited Arab EmiratesUnited KingdomUnited StatesUpper middle incomeUruguayUzbekistanVanuatuVenezuela, RBVietnamVirgin Islands (U.S.)West Bank and GazaWorldYemen, Rep.ZambiaZimbabwe Timeline:
This timeline shows a graph from 1971 to 2016 of World. No data until 1970. Number of actual observations by date: 46.
Source name:
World Development Indicators
Source organization:
Estimates based on sources and methods described in "The Changing Wealth of Nations: Measuring Sustainable Development in the New Millennium" (World Bank, 2011).
Categories, topics:
Environment
Last updated:
apr 23, 2017
Indicators value changes by year
At the date of observation
Value
Absolute change
Change from previous value
jan 1, 1971
0.072
+0.072
0.0%
jan 1, 1972
0.082
+0.009
12.74%
jan 1, 1973
0.077
-0.005
-6.04%
jan 1, 1974
0.077
0.0
-0.17%
jan 1, 1975
0.16
+0.084
109.56%
jan 1, 1976
0.429
+0.269
167.73%
jan 1, 1977
0.44
+0.011
2.55%
jan 1, 1978
0.413
-0.028
-6.25%
jan 1, 1979
0.304
-0.109
-26.42%
jan 1, 1980
0.273
-0.03
-10.04%
jan 1, 1981
0.352
+0.079
28.81%
jan 1, 1982
0.573
+0.221
62.7%
jan 1, 1983
0.632
+0.059
10.34%
jan 1, 1984
0.355
-0.277
-43.8%
jan 1, 1985
0.279
-0.076
-21.51%
jan 1, 1986
0.3
+0.021
7.61%
jan 1, 1987
0.162
-0.138
-46.12%
jan 1, 1988
0.071
-0.091
-56.29%
jan 1, 1989
0.095
+0.024
34.16%
jan 1, 1990
0.128
+0.033
35.11%
jan 1, 1991
0.156
+0.028
21.94%
jan 1, 1992
0.136
-0.02
-12.75%
jan 1, 1993
0.103
-0.034
-24.71%
jan 1, 1994
0.055
-0.047
-46.21%
jan 1, 1995
0.043
-0.012
-21.78%
jan 1, 1996
0.089
+0.046
106.09%
jan 1, 1997
0.085
-0.004
-4.91%
jan 1, 1998
0.08
-0.004
-4.83%
jan 1, 1999
0.074
-0.007
-8.61%
jan 1, 2000
0.054
-0.02
-27.03%
jan 1, 2001
0.071
+0.017
32.2%
jan 1, 2002
0.158
+0.087
122.11%
jan 1, 2003
0.09
-0.068
-42.9%
jan 1, 2004
0.09
+0.0
0.42%
jan 1, 2005
0.315
+0.225
248.79%
jan 1, 2006
0.263
-0.053
-16.72%
jan 1, 2007
0.269
+0.006
2.46%
jan 1, 2008
0.29
+0.021
7.75%
jan 1, 2009
0.804
+0.514
177.25%
jan 1, 2010
0.321
-0.483
-60.11%
jan 1, 2011
0.496
+0.175
54.67%
jan 1, 2012
0.684
+0.188
37.85%
jan 1, 2013
0.388
-0.296
-43.26%
jan 1, 2014
0.273
-0.115
-29.71%
jan 1, 2015
0.22
-0.053
-19.3%
jan 1, 2016
0.15
-0.07
-31.88%
Ranking of countries by current statistics by years


Comments: