29
/
en
AIzaSyAYiBZKx7MnpbEhh9jyipgxe19OcubqV5w
April 1, 2024
37213
IDA & IBRD total
IBT
false
2
1
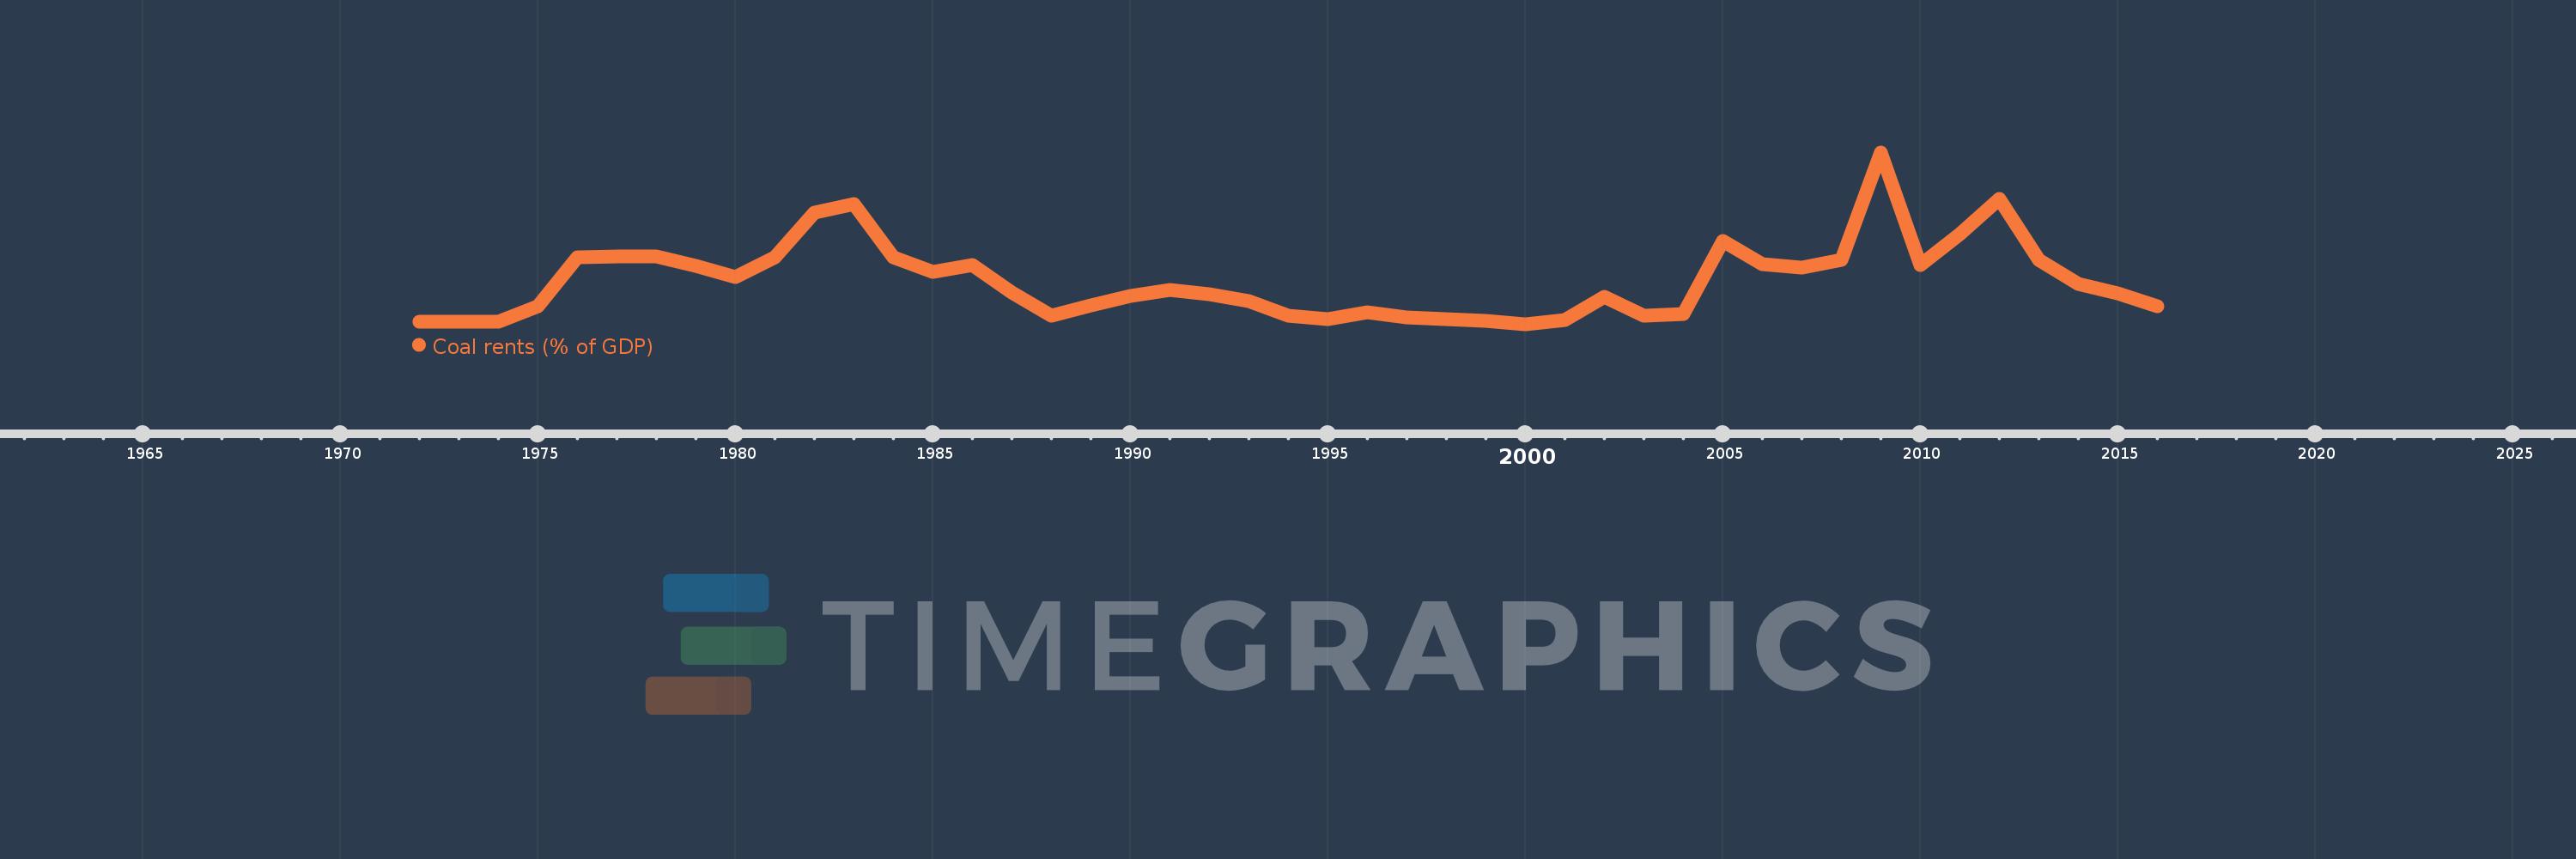
Coal rents (% of GDP)
2016,2015,2014,2013,2012,2011,2010,2009,2008,2007,2006,2005,2004,2003,2002,2001,2000,1999,1998,1997,1996,1995,1994,1993,1992,1991,1990,1989,1988,1987,1986,1985,1984,1983,1982,1981,1980,1979,1978,1977,1976,1975,1974,1973,1972
This statistics in other country:
AfghanistanAlbaniaAlgeriaAngolaAntigua and BarbudaArab WorldArgentinaArmeniaArubaAustraliaAustriaAzerbaijanBahamas, TheBahrainBangladeshBarbadosBelarusBelgiumBelizeBeninBermudaBhutanBoliviaBosnia and HerzegovinaBotswanaBrazilBrunei DarussalamBulgariaBurkina FasoBurundiCabo VerdeCambodiaCameroonCanadaCaribbean small statesCayman IslandsCentral African RepublicCentral Europe and the BalticsChadChileChinaColombiaComorosCongo, Dem. Rep.Congo, Rep.Costa RicaCote d'IvoireCroatiaCubaCyprusCzech RepublicDenmarkDjiboutiDominicaDominican RepublicEarly-demographic dividendEast Asia & PacificEast Asia & Pacific (excluding high income)East Asia & Pacific (IDA & IBRD countries)EcuadorEgypt, Arab Rep.El SalvadorEquatorial GuineaEritreaEstoniaEthiopiaEuro areaEurope & Central AsiaEurope & Central Asia (excluding high income)Europe & Central Asia (IDA & IBRD countries)European UnionFijiFinlandFragile and conflict affected situationsFranceFrench PolynesiaGabonGambia, TheGeorgiaGermanyGhanaGreeceGreenlandGrenadaGuatemalaGuineaGuinea-BissauGuyanaHaitiHeavily indebted poor countries (HIPC)High incomeHondurasHong Kong SAR, ChinaHungaryIBRD onlyIcelandIDA & IBRD totalIDA blendIDA onlyIDA totalIndiaIndonesiaIran, Islamic Rep.IraqIrelandIsraelItalyJamaicaJapanJordanKazakhstanKenyaKiribatiKorea, Rep.KosovoKuwaitKyrgyz RepublicLao PDRLate-demographic dividendLatin America & Caribbean Latin America & Caribbean (excluding high income)Latin America & the Caribbean (IDA & IBRD countries)LatviaLeast developed countries: UN classificationLebanonLesothoLiberiaLibyaLithuaniaLow & middle incomeLow incomeLower middle incomeLuxembourgMacao SAR, ChinaMacedonia, FYRMadagascarMalawiMalaysiaMaldivesMaliMaltaMauritaniaMauritiusMexicoMiddle East & North AfricaMiddle East & North Africa (excluding high income)Middle East & North Africa (IDA & IBRD countries)Middle incomeMoldovaMongoliaMontenegroMoroccoMozambiqueMyanmarNamibiaNepalNetherlandsNew CaledoniaNew ZealandNicaraguaNigerNigeriaNorth AmericaNorwayOECD membersOmanOther small statesPacific island small statesPakistanPanamaPapua New GuineaParaguayPeruPhilippinesPolandPortugalPost-demographic dividendPre-demographic dividendPuerto RicoQatarRomaniaRussian FederationRwandaSamoaSao Tome and PrincipeSaudi ArabiaSenegalSerbiaSeychellesSierra LeoneSingaporeSlovak RepublicSloveniaSmall statesSolomon IslandsSouth AfricaSouth AsiaSouth Asia (IDA & IBRD)SpainSri LankaSt. Kitts and NevisSt. LuciaSt. Vincent and the GrenadinesSub-Saharan Africa Sub-Saharan Africa (excluding high income)Sub-Saharan Africa (IDA & IBRD countries)SudanSurinameSwazilandSwedenSwitzerlandSyrian Arab RepublicTajikistanTanzaniaThailandTimor-LesteTogoTongaTrinidad and TobagoTunisiaTurkeyTurkmenistanUgandaUkraineUnited Arab EmiratesUnited KingdomUnited StatesUpper middle incomeUruguayUzbekistanVanuatuVenezuela, RBVietnamVirgin Islands (U.S.)West Bank and GazaWorldYemen, Rep.ZambiaZimbabwe Timeline:
This timeline shows a graph from 1972 to 2016 of IDA & IBRD total. No data until 1971. Number of actual observations by date: 45.
Source name:
World Development Indicators
Source organization:
Estimates based on sources and methods described in "The Changing Wealth of Nations: Measuring Sustainable Development in the New Millennium" (World Bank, 2011).
Categories, topics:
Environment
Last updated:
apr 23, 2017
Indicators value changes by year
At the date of observation
Value
Absolute change
Change from previous value
jan 1, 1972
0.11
+0.11
0.0%
jan 1, 1973
0.106
-0.003
-3.01%
jan 1, 1974
0.107
+0.001
1.01%
jan 1, 1975
0.275
+0.167
155.91%
jan 1, 1976
0.821
+0.546
198.61%
jan 1, 1977
0.831
+0.01
1.24%
jan 1, 1978
0.835
+0.004
0.46%
jan 1, 1979
0.727
-0.107
-12.85%
jan 1, 1980
0.605
-0.122
-16.76%
jan 1, 1981
0.822
+0.217
35.77%
jan 1, 1982
1.321
+0.499
60.71%
jan 1, 1983
1.41
+0.089
6.7%
jan 1, 1984
0.819
-0.591
-41.91%
jan 1, 1985
0.658
-0.161
-19.66%
jan 1, 1986
0.737
+0.079
12.05%
jan 1, 1987
0.433
-0.304
-41.22%
jan 1, 1988
0.172
-0.261
-60.29%
jan 1, 1989
0.288
+0.116
67.34%
jan 1, 1990
0.395
+0.107
37.1%
jan 1, 1991
0.46
+0.065
16.43%
jan 1, 1992
0.416
-0.044
-9.49%
jan 1, 1993
0.331
-0.084
-20.3%
jan 1, 1994
0.171
-0.16
-48.34%
jan 1, 1995
0.133
-0.039
-22.61%
jan 1, 1996
0.213
+0.08
60.5%
jan 1, 1997
0.159
-0.054
-25.22%
jan 1, 1998
0.132
-0.027
-16.88%
jan 1, 1999
0.12
-0.012
-9.31%
jan 1, 2000
0.079
-0.041
-34.51%
jan 1, 2001
0.125
+0.046
59.02%
jan 1, 2002
0.387
+0.262
209.75%
jan 1, 2003
0.177
-0.209
-54.14%
jan 1, 2004
0.193
+0.016
9.03%
jan 1, 2005
1.0
+0.806
416.83%
jan 1, 2006
0.747
-0.253
-25.28%
jan 1, 2007
0.711
-0.036
-4.8%
jan 1, 2008
0.794
+0.082
11.6%
jan 1, 2009
1.985
+1.191
150.12%
jan 1, 2010
0.734
-1.251
-63.04%
jan 1, 2011
1.08
+0.347
47.27%
jan 1, 2012
1.471
+0.391
36.19%
jan 1, 2013
0.79
-0.682
-46.32%
jan 1, 2014
0.528
-0.262
-33.16%
jan 1, 2015
0.422
-0.106
-20.05%
jan 1, 2016
0.278
-0.144
-34.1%
Ranking of countries by current statistics by years


Comments: