29
/
en
AIzaSyAYiBZKx7MnpbEhh9jyipgxe19OcubqV5w
April 1, 2024
58630
South Asia (IDA & IBRD)
TSA
false
2
1
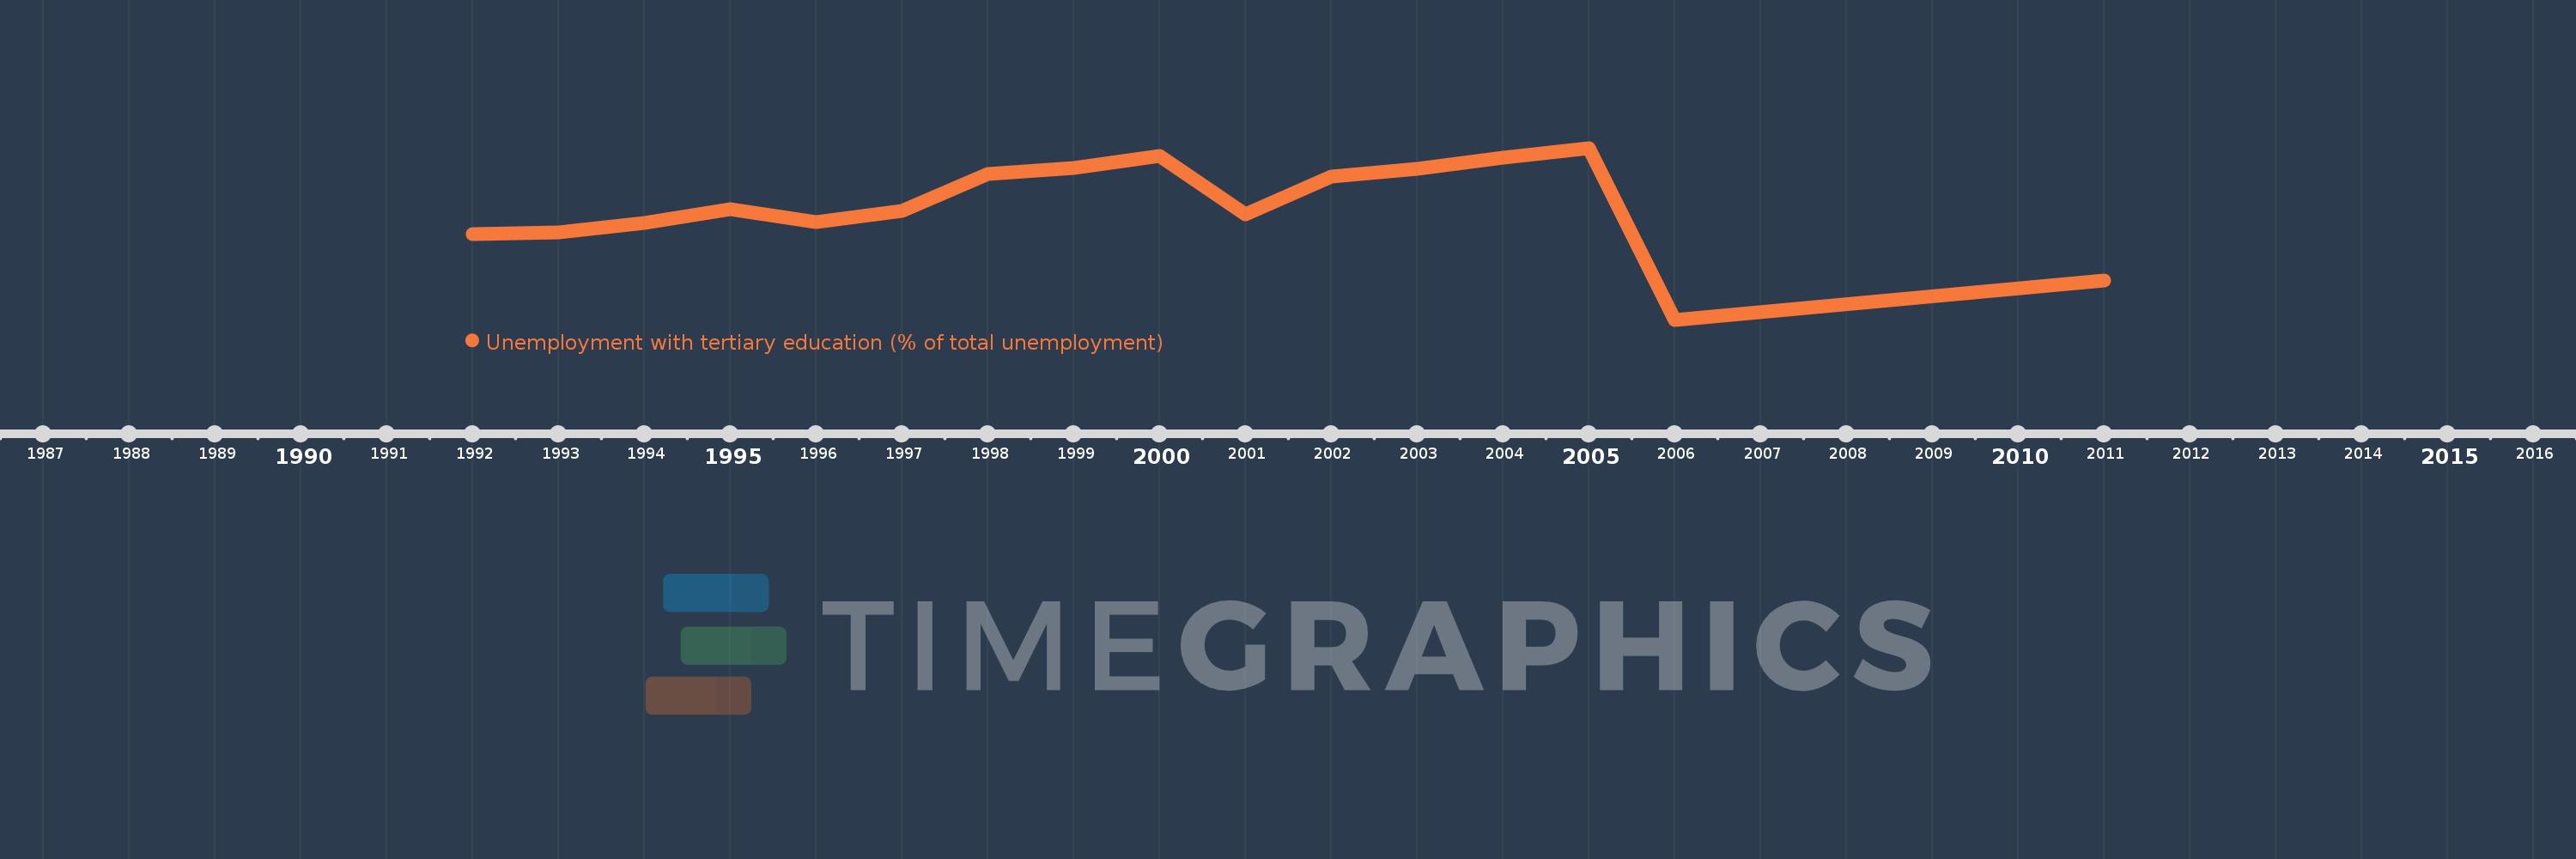
Unemployment with tertiary education (% of total unemployment)
2011,2006,2005,2004,2003,2002,2001,2000,1999,1998,1997,1996,1995,1994,1993,1992
This statistics in other country:
Timeline:
This timeline shows a graph from 1992 to 2011 of South Asia (IDA & IBRD). No data until 1991. Number of actual observations by date: 16.
Source name:
World Development Indicators
Source organization:
International Labour Organization, Key Indicators of the Labour Market database.
Categories, topics:
Social Protection & Labor
Last updated:
apr 23, 2017
Indicators value changes by year
Minimum:
20.228
jan 1, 2006
Maximum:
31.186
jan 1, 2005
At the date of observation
Value
Absolute change
Change from previous value
jan 1, 1992
25.7
+25.7
0.0%
jan 1, 1993
25.8
+0.1
0.39%
jan 1, 1994
26.4
+0.6
2.33%
jan 1, 1995
27.3
+0.9
3.41%
jan 1, 1996
26.448
-0.852
-3.12%
jan 1, 1997
27.166
+0.718
2.72%
jan 1, 1998
29.5
+2.334
8.59%
jan 1, 1999
29.9
+0.4
1.36%
jan 1, 2000
30.7
+0.8
2.68%
jan 1, 2001
26.963
-3.737
-12.17%
jan 1, 2002
29.352
+2.388
8.86%
jan 1, 2003
29.839
+0.487
1.66%
jan 1, 2004
30.581
+0.742
2.49%
jan 1, 2005
31.186
+0.606
1.98%
jan 1, 2006
20.228
-10.959
-35.14%
jan 1, 2011
22.729
+2.501
12.36%
Ranking of countries by current statistics by years


Comments: