29
/
en
AIzaSyAYiBZKx7MnpbEhh9jyipgxe19OcubqV5w
April 1, 2024
55245
Post-demographic dividend
PST
false
2
1
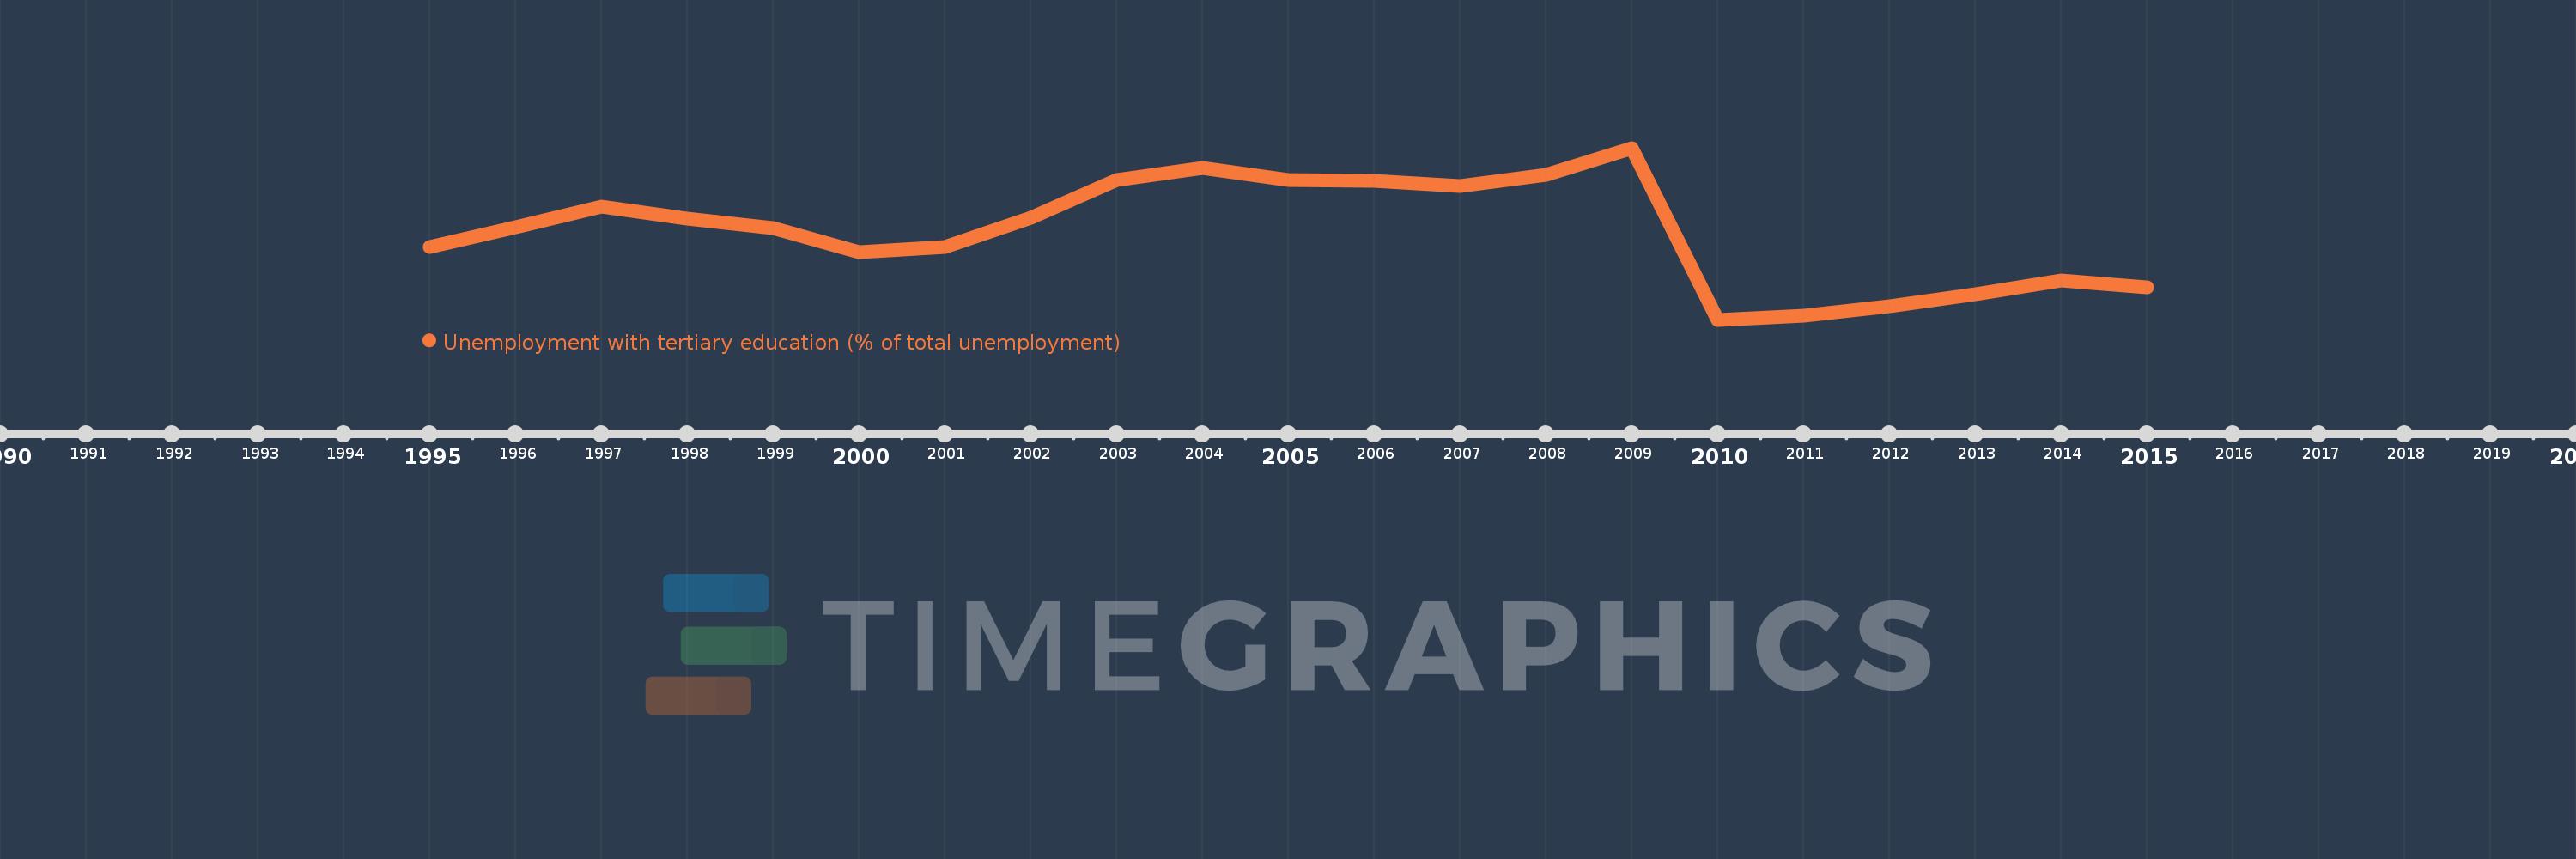
Unemployment with tertiary education (% of total unemployment)
2015,2014,2013,2012,2011,2010,2009,2008,2007,2006,2005,2004,2003,2002,2001,2000,1999,1998,1997,1996,1995
This statistics in other country:
Timeline:
This timeline shows a graph from 1995 to 2015 of Post-demographic dividend. No data until 1994. Number of actual observations by date: 21.
Source name:
World Development Indicators
Source organization:
International Labour Organization, Key Indicators of the Labour Market database.
Categories, topics:
Social Protection & Labor
Last updated:
apr 23, 2017
Indicators value changes by year
Minimum:
17.631
jan 1, 2010
Maximum:
27.948
jan 1, 2009
At the date of observation
Value
Absolute change
Change from previous value
jan 1, 1995
22.016
+22.016
0.0%
jan 1, 1996
23.195
+1.179
5.35%
jan 1, 1997
24.435
+1.241
5.35%
jan 1, 1998
23.709
-0.726
-2.97%
jan 1, 1999
23.141
-0.568
-2.39%
jan 1, 2000
21.693
-1.448
-6.26%
jan 1, 2001
21.988
+0.295
1.36%
jan 1, 2002
23.73
+1.741
7.92%
jan 1, 2003
26.017
+2.287
9.64%
jan 1, 2004
26.739
+0.722
2.78%
jan 1, 2005
26.029
-0.71
-2.65%
jan 1, 2006
25.947
-0.083
-0.32%
jan 1, 2007
25.651
-0.296
-1.14%
jan 1, 2008
26.353
+0.702
2.74%
jan 1, 2009
27.948
+1.595
6.05%
jan 1, 2010
17.631
-10.317
-36.91%
jan 1, 2011
17.871
+0.24
1.36%
jan 1, 2012
18.428
+0.556
3.11%
jan 1, 2013
19.164
+0.737
4.0%
jan 1, 2014
19.997
+0.833
4.35%
jan 1, 2015
19.576
-0.422
-2.11%
Ranking of countries by current statistics by years


Comments: