29
/
en
AIzaSyAYiBZKx7MnpbEhh9jyipgxe19OcubqV5w
April 1, 2024
47836
Lower middle income
LMC
false
2
1
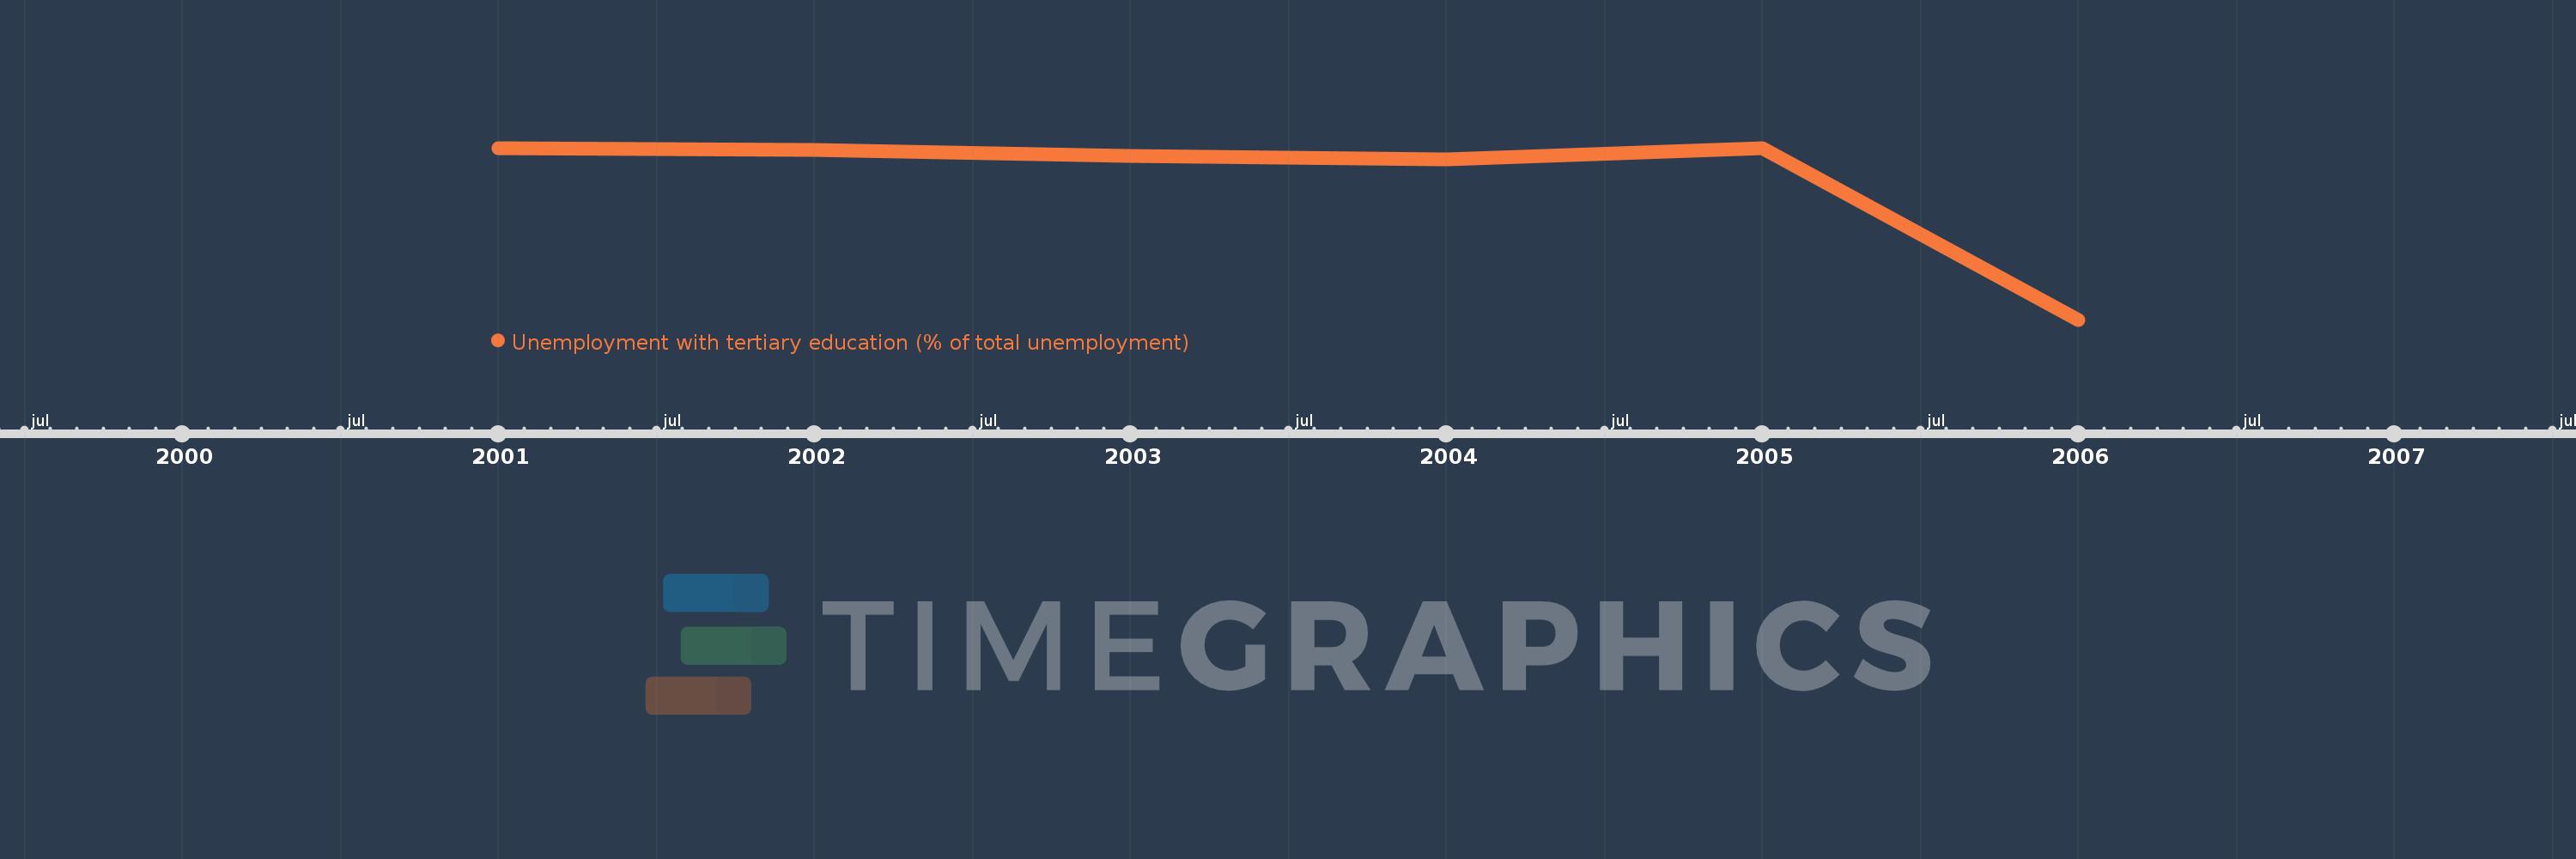
Unemployment with tertiary education (% of total unemployment)
2006,2005,2004,2003,2002,2001
This statistics in other country:
Timeline:
This timeline shows a graph from 2001 to 2006 of Lower middle income. No data until 2000. Number of actual observations by date: 6.
Source name:
World Development Indicators
Source organization:
International Labour Organization, Key Indicators of the Labour Market database.
Categories, topics:
Social Protection & Labor
Last updated:
apr 23, 2017
Indicators value changes by year
Minimum:
17.948
jan 1, 2006
Maximum:
23.822
jan 1, 2005
At the date of observation
Value
Absolute change
Change from previous value
jan 1, 2001
23.819
+23.819
0.0%
jan 1, 2002
23.767
-0.053
-0.22%
jan 1, 2003
23.553
-0.214
-0.9%
jan 1, 2004
23.417
-0.136
-0.58%
jan 1, 2005
23.822
+0.405
1.73%
jan 1, 2006
17.948
-5.874
-24.66%
Ranking of countries by current statistics by years


Comments: