29
/
en
AIzaSyAYiBZKx7MnpbEhh9jyipgxe19OcubqV5w
April 1, 2024
52329
North America
NAC
false
2
1
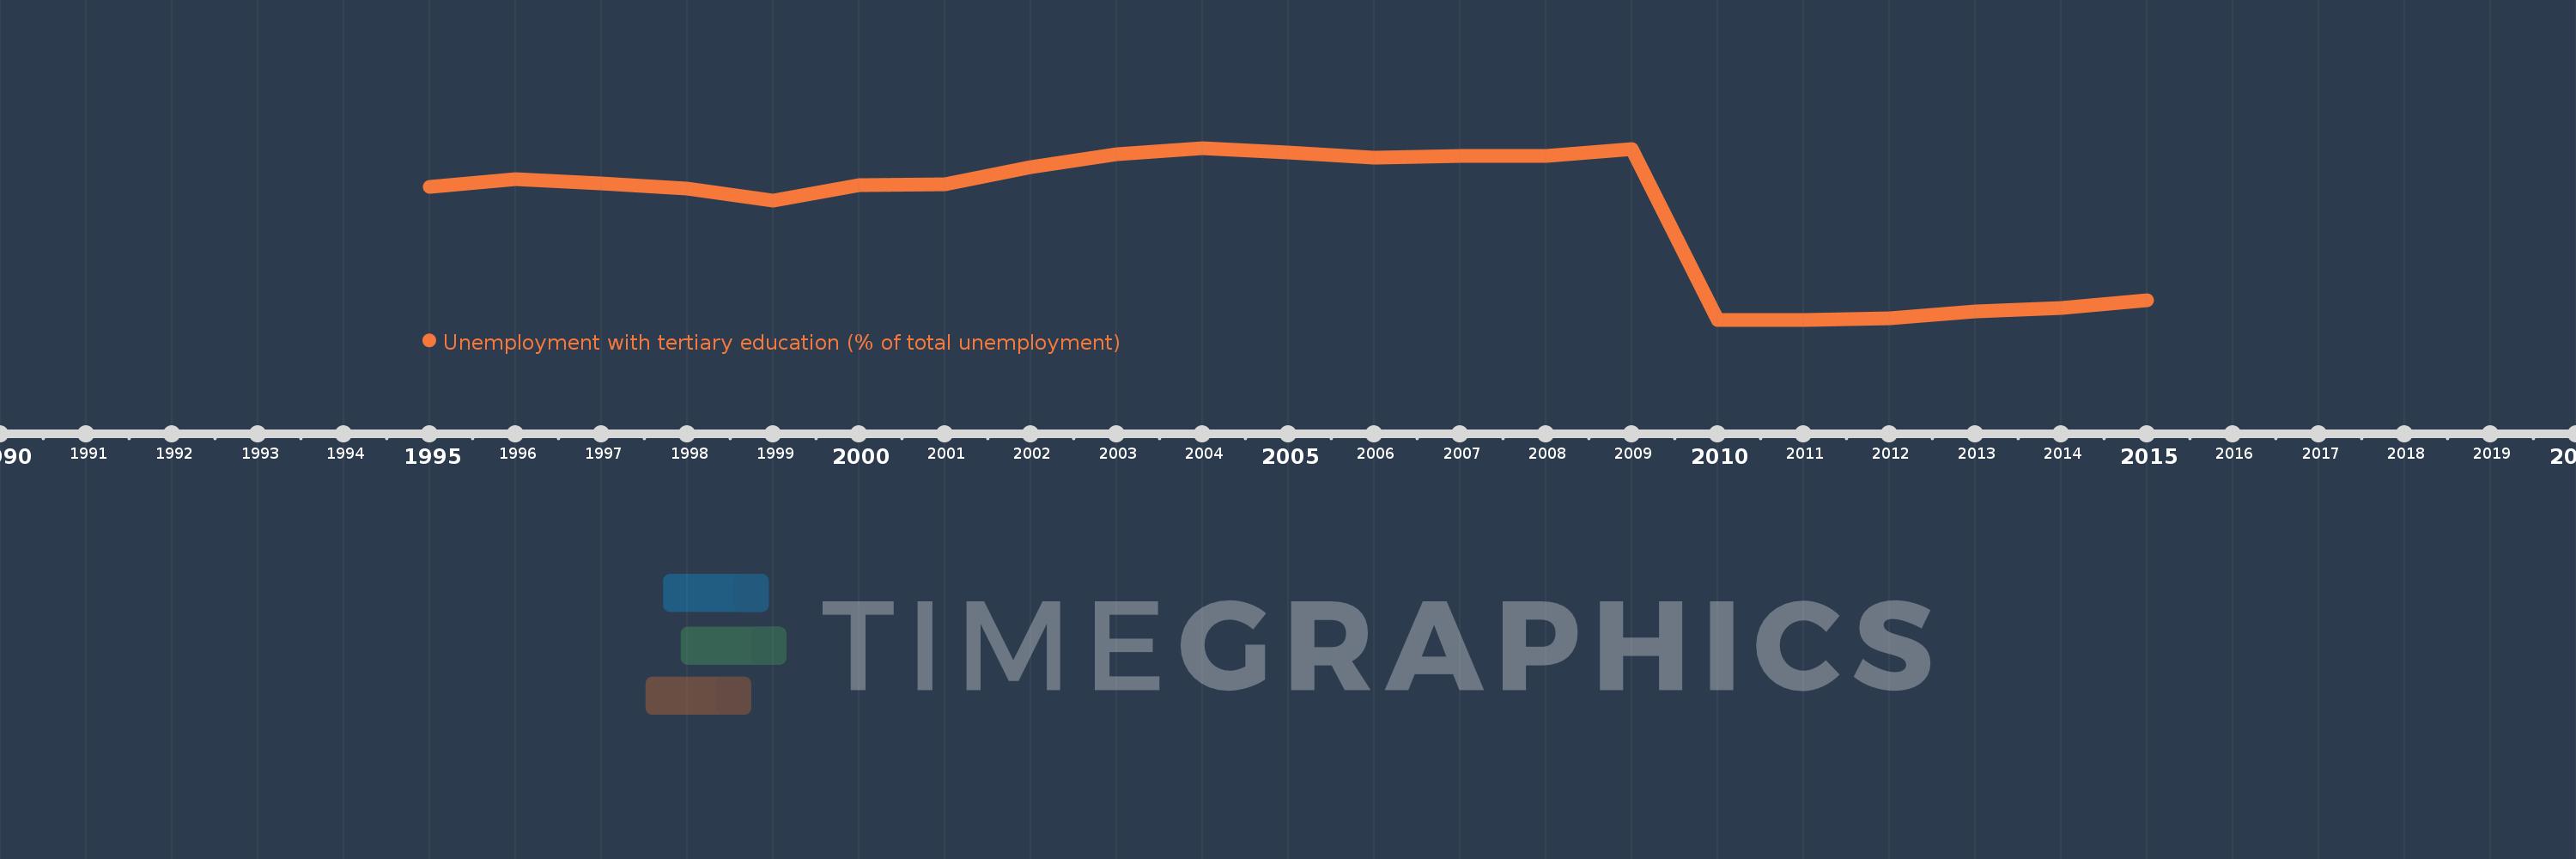
Unemployment with tertiary education (% of total unemployment)
2015,2014,2013,2012,2011,2010,2009,2008,2007,2006,2005,2004,2003,2002,2001,2000,1999,1998,1997,1996,1995
This statistics in other country:
Timeline:
This timeline shows a graph from 1995 to 2015 of North America. No data until 1994. Number of actual observations by date: 21.
Source name:
World Development Indicators
Source organization:
International Labour Organization, Key Indicators of the Labour Market database.
Categories, topics:
Social Protection & Labor
Last updated:
apr 23, 2017
Indicators value changes by year
Minimum:
17.497
jan 1, 2010
Maximum:
45.131
jan 1, 2004
At the date of observation
Value
Absolute change
Change from previous value
jan 1, 1995
38.858
+38.858
0.0%
jan 1, 1996
40.17
+1.312
3.38%
jan 1, 1997
39.367
-0.803
-2.0%
jan 1, 1998
38.587
-0.78
-1.98%
jan 1, 1999
36.713
-1.874
-4.86%
jan 1, 2000
39.204
+2.491
6.78%
jan 1, 2001
39.226
+0.022
0.06%
jan 1, 2002
42.042
+2.817
7.18%
jan 1, 2003
44.103
+2.061
4.9%
jan 1, 2004
45.131
+1.029
2.33%
jan 1, 2005
44.336
-0.795
-1.76%
jan 1, 2006
43.594
-0.742
-1.67%
jan 1, 2007
43.824
+0.23
0.53%
jan 1, 2008
43.812
-0.013
-0.03%
jan 1, 2009
45.001
+1.189
2.71%
jan 1, 2010
17.497
-27.504
-61.12%
jan 1, 2011
17.512
+0.015
0.09%
jan 1, 2012
17.752
+0.24
1.37%
jan 1, 2013
18.784
+1.032
5.81%
jan 1, 2014
19.34
+0.557
2.96%
jan 1, 2015
20.595
+1.255
6.49%
Ranking of countries by current statistics by years


Comments: