29
/
en
AIzaSyAYiBZKx7MnpbEhh9jyipgxe19OcubqV5w
April 1, 2024
53056
OECD members
OED
false
2
1
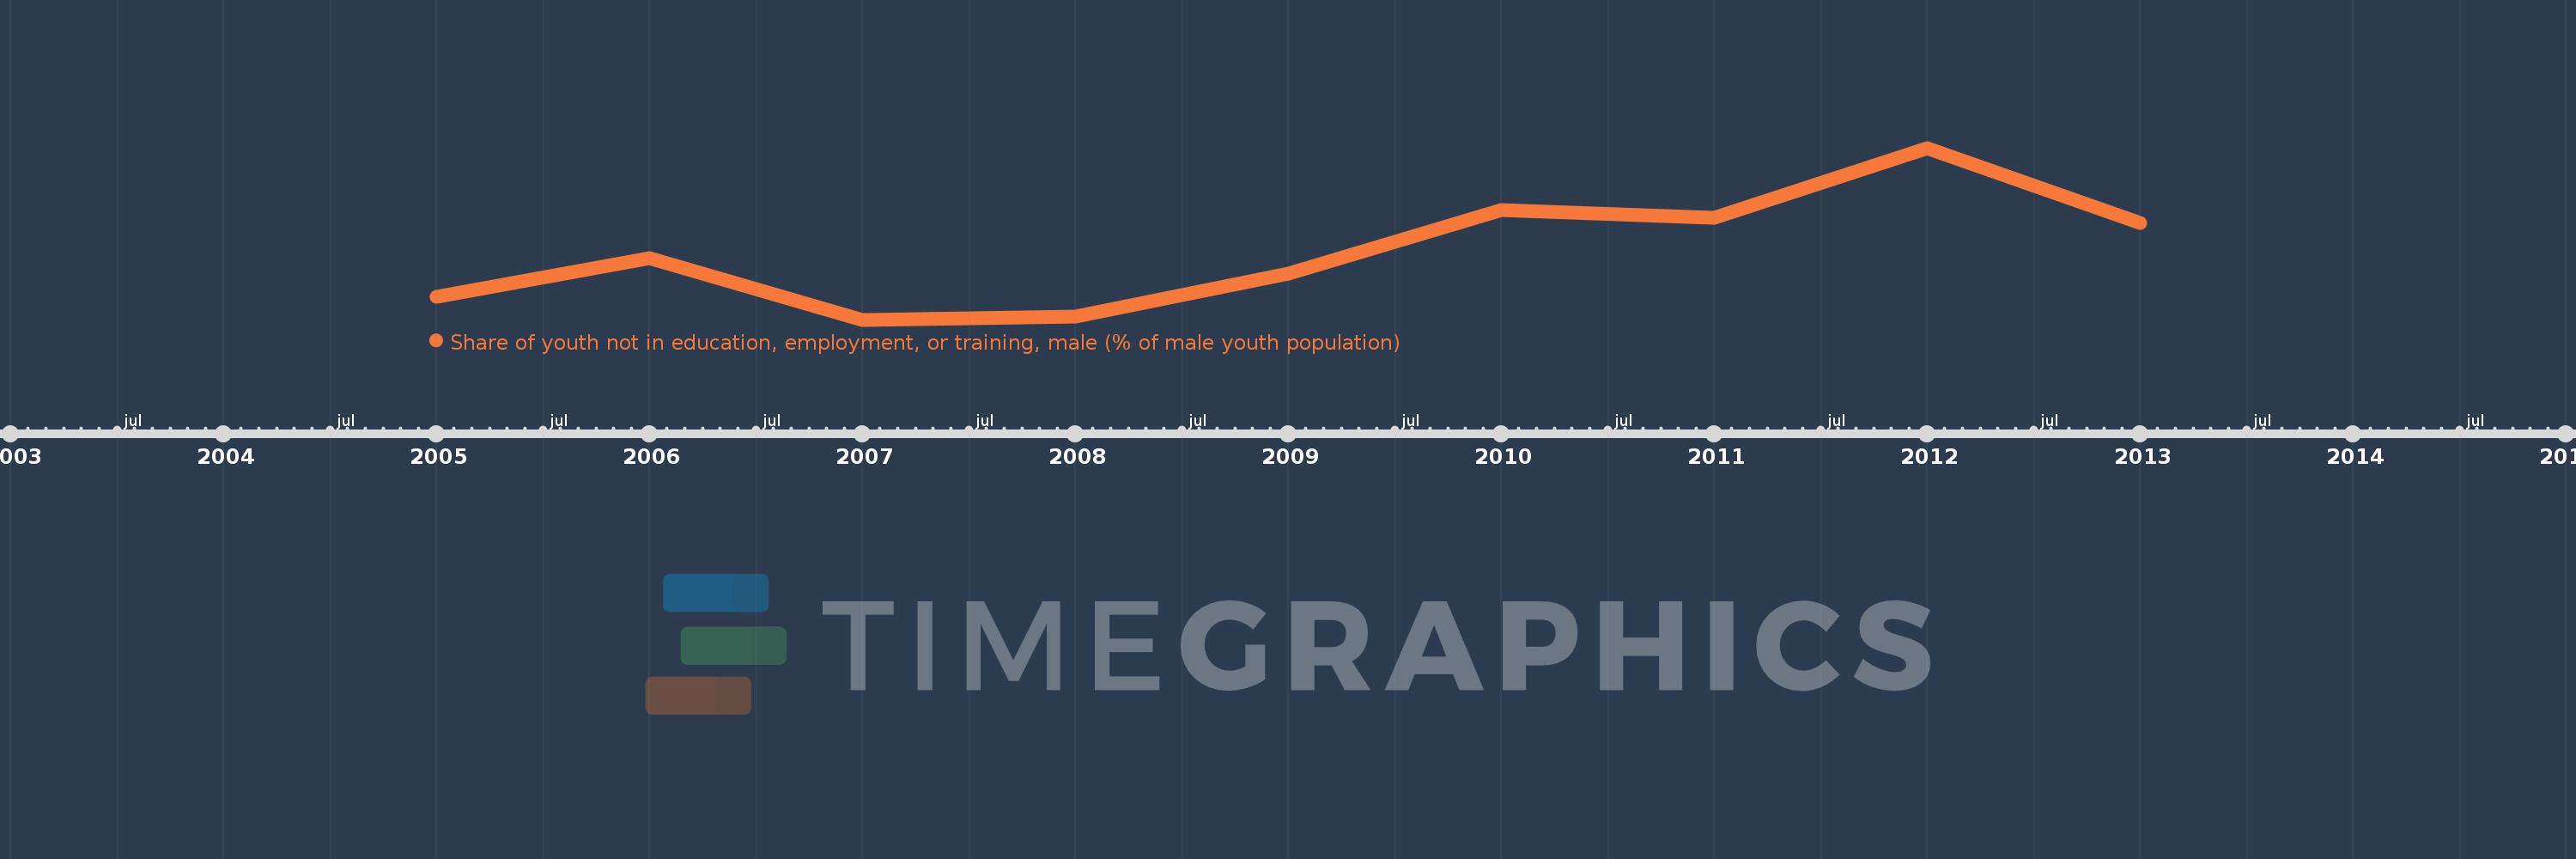
Share of youth not in education, employment, or training, male (% of male youth population)
2013,2012,2011,2010,2009,2008,2007,2006,2005
This statistics in other country:
Timeline:
This timeline shows a graph from 2005 to 2013 of OECD members. No data until 2004. Number of actual observations by date: 9.
Source name:
World Development Indicators
Source organization:
International Labour Organization, Key Indicators of the Labour Market database.
Categories, topics:
Social Protection & Labor
Last updated:
apr 23, 2017
Indicators value changes by year
Minimum:
10.848
jan 1, 2007
Maximum:
13.749
jan 1, 2012
At the date of observation
Value
Absolute change
Change from previous value
jan 1, 2005
11.233
+11.233
0.0%
jan 1, 2006
11.885
+0.651
5.8%
jan 1, 2007
10.848
-1.037
-8.72%
jan 1, 2008
10.895
+0.047
0.43%
jan 1, 2009
11.633
+0.739
6.78%
jan 1, 2010
12.698
+1.064
9.15%
jan 1, 2011
12.57
-0.128
-1.01%
jan 1, 2012
13.749
+1.179
9.38%
jan 1, 2013
12.488
-1.261
-9.17%
Ranking of countries by current statistics by years


Comments: