29
/
en
AIzaSyAYiBZKx7MnpbEhh9jyipgxe19OcubqV5w
April 1, 2024
31144
Europe & Central Asia
ECS
false
2
1
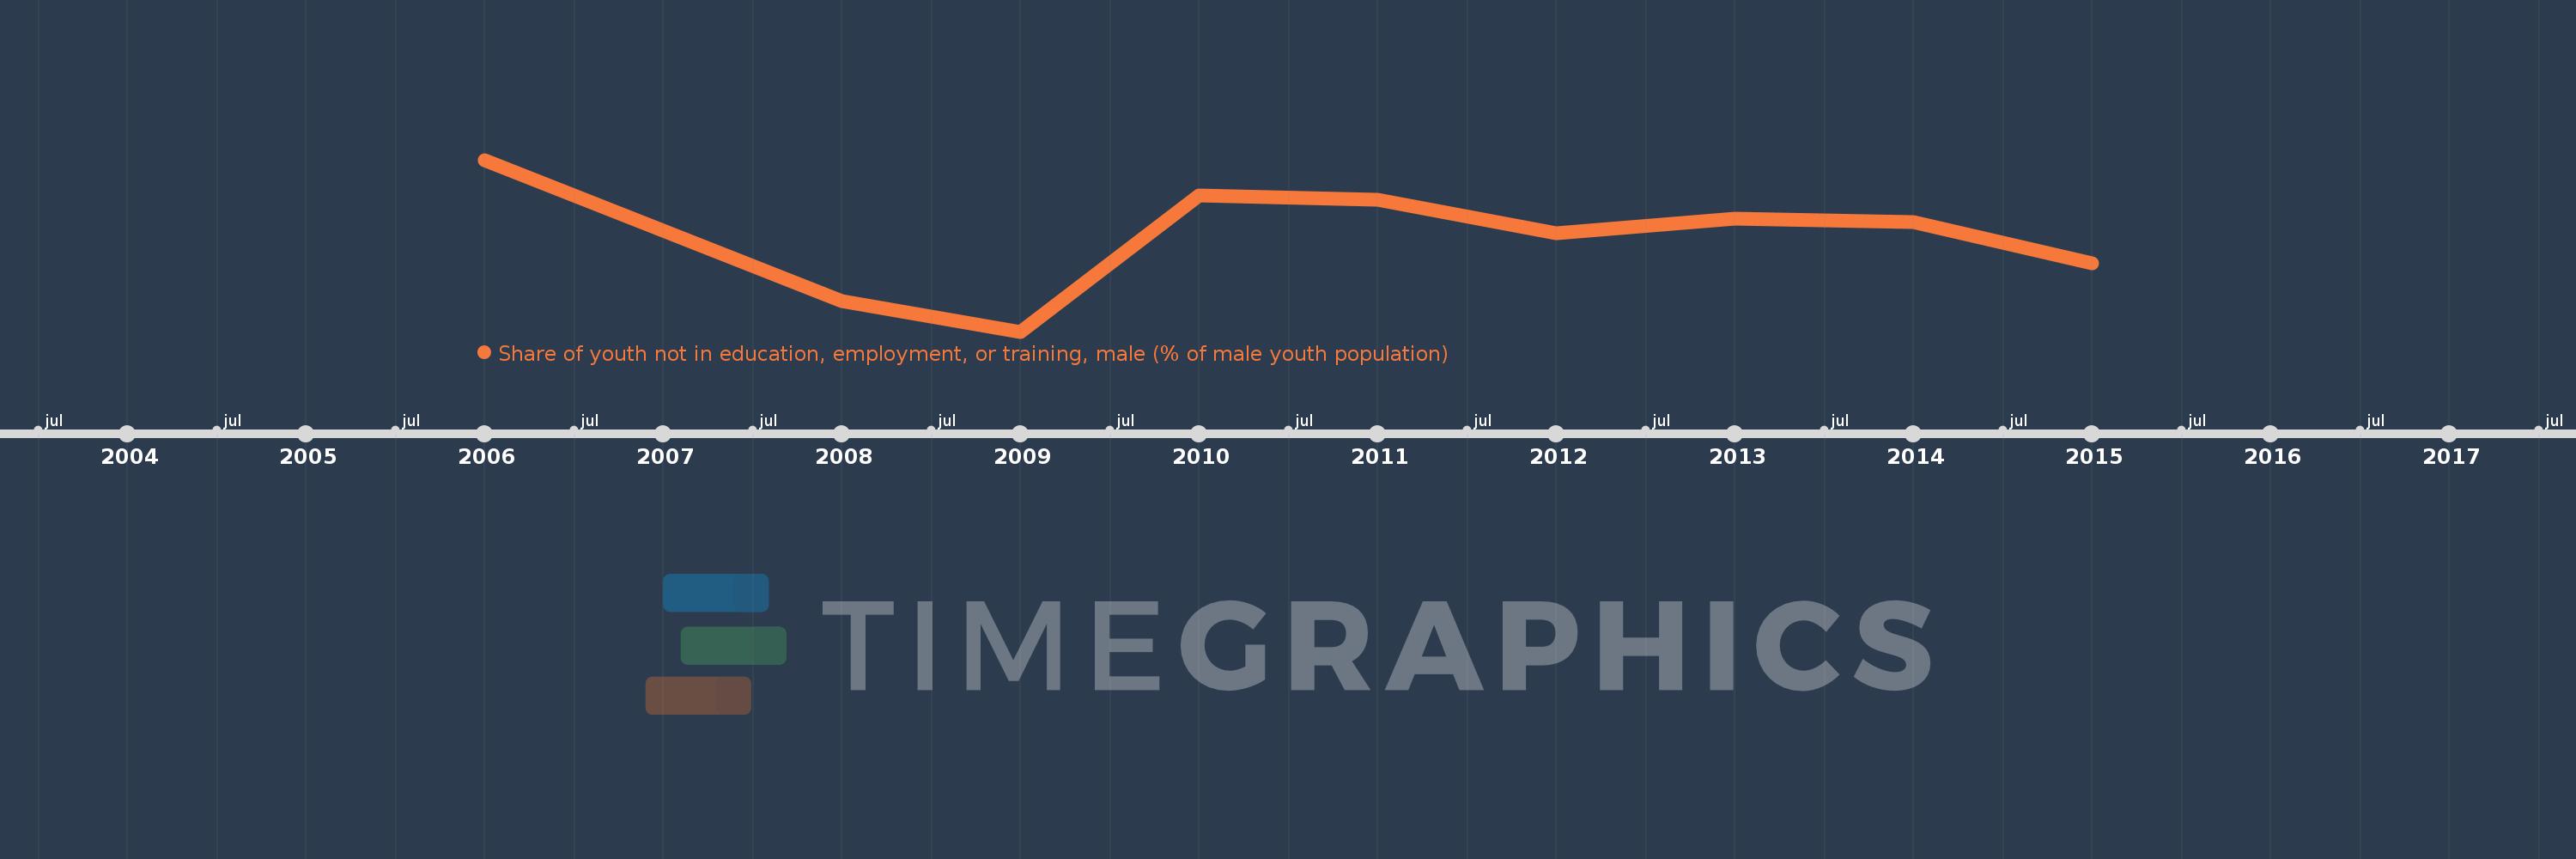
Share of youth not in education, employment, or training, male (% of male youth population)
2015,2014,2013,2012,2011,2010,2009,2008,2006
This statistics in other country:
Timeline:
This timeline shows a graph from 2006 to 2015 of Europe & Central Asia. No data until 2005. Number of actual observations by date: 9.
Source name:
World Development Indicators
Source organization:
International Labour Organization, Key Indicators of the Labour Market database.
Categories, topics:
Social Protection & Labor
Last updated:
apr 23, 2017
Indicators value changes by year
Minimum:
11.811
jan 1, 2009
Maximum:
14.195
jan 1, 2006
At the date of observation
Value
Absolute change
Change from previous value
jan 1, 2006
14.195
+14.195
0.0%
jan 1, 2008
12.239
-1.957
-13.78%
jan 1, 2009
11.811
-0.428
-3.5%
jan 1, 2010
13.705
+1.894
16.04%
jan 1, 2011
13.637
-0.069
-0.5%
jan 1, 2012
13.171
-0.466
-3.41%
jan 1, 2013
13.377
+0.206
1.57%
jan 1, 2014
13.333
-0.044
-0.33%
jan 1, 2015
12.764
-0.569
-4.27%
Ranking of countries by current statistics by years


Comments: