29
/
en
AIzaSyAYiBZKx7MnpbEhh9jyipgxe19OcubqV5w
April 1, 2024
181636
Lithuania
LTU
true
2
1
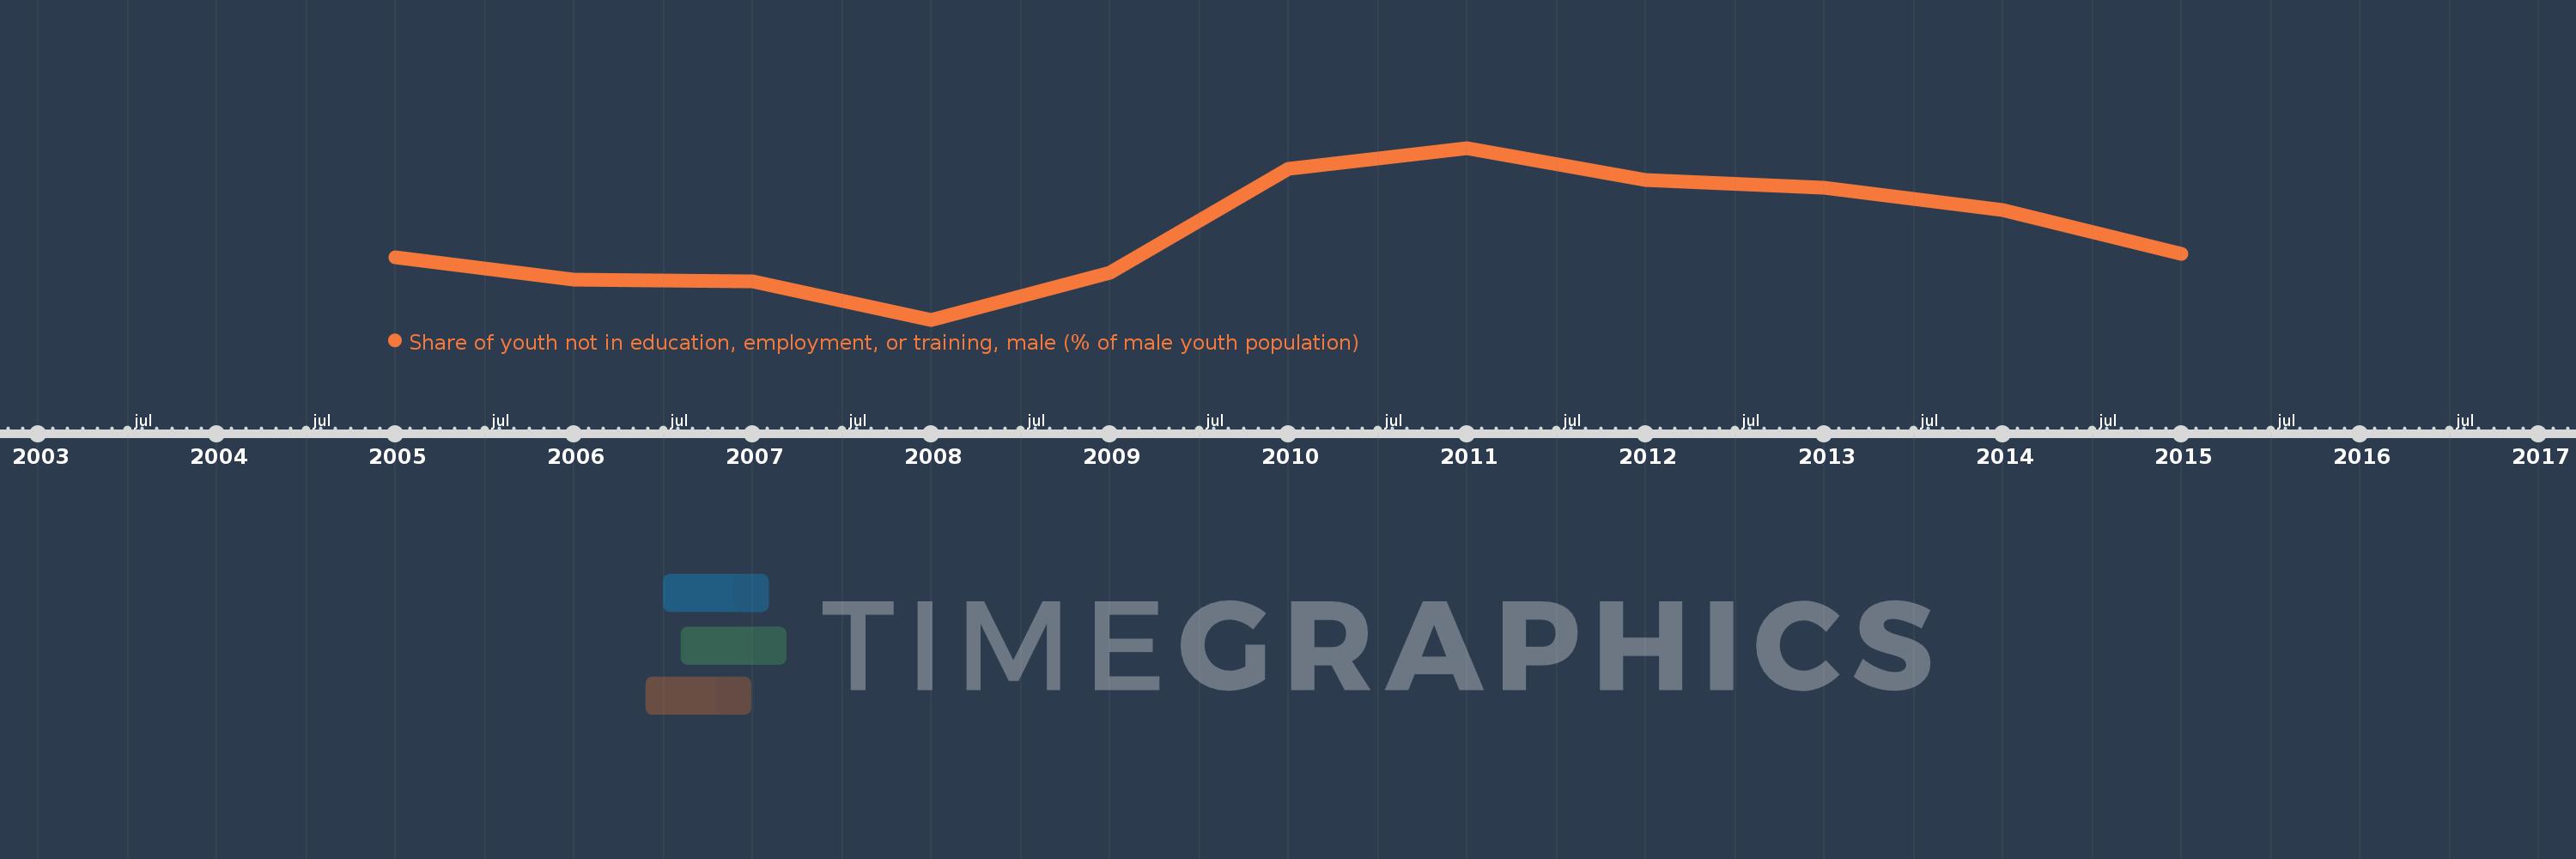
Share of youth not in education, employment, or training, male (% of male youth population)
2015,2014,2013,2012,2011,2010,2009,2008,2007,2006,2005
This statistics in other country:
Timeline:
This timeline shows a graph from 2005 to 2015 of Lithuania. No data until 2004. Number of actual observations by date: 11.
Source name:
World Development Indicators
Source organization:
International Labour Organization, Key Indicators of the Labour Market database.
Categories, topics:
Social Protection & Labor
Last updated:
apr 23, 2017
Indicators value changes by year
At the date of observation
Value
Absolute change
Change from previous value
jan 1, 2005
9.34
+9.34
0.0%
jan 1, 2006
8.23
-1.11
-11.88%
jan 1, 2007
8.16
-0.07
-0.85%
jan 1, 2008
6.28
-1.88
-23.04%
jan 1, 2009
8.57
+2.29
36.46%
jan 1, 2010
13.65
+5.08
59.28%
jan 1, 2011
14.69
+1.04
7.62%
jan 1, 2012
13.14
-1.55
-10.55%
jan 1, 2013
12.76
-0.38
-2.89%
jan 1, 2014
11.64
-1.12
-8.78%
jan 1, 2015
9.51
-2.13
-18.3%
Ranking of countries by current statistics by years


Comments: