29
/
en
AIzaSyAYiBZKx7MnpbEhh9jyipgxe19OcubqV5w
April 1, 2024
30306
Euro area
EMU
false
2
1
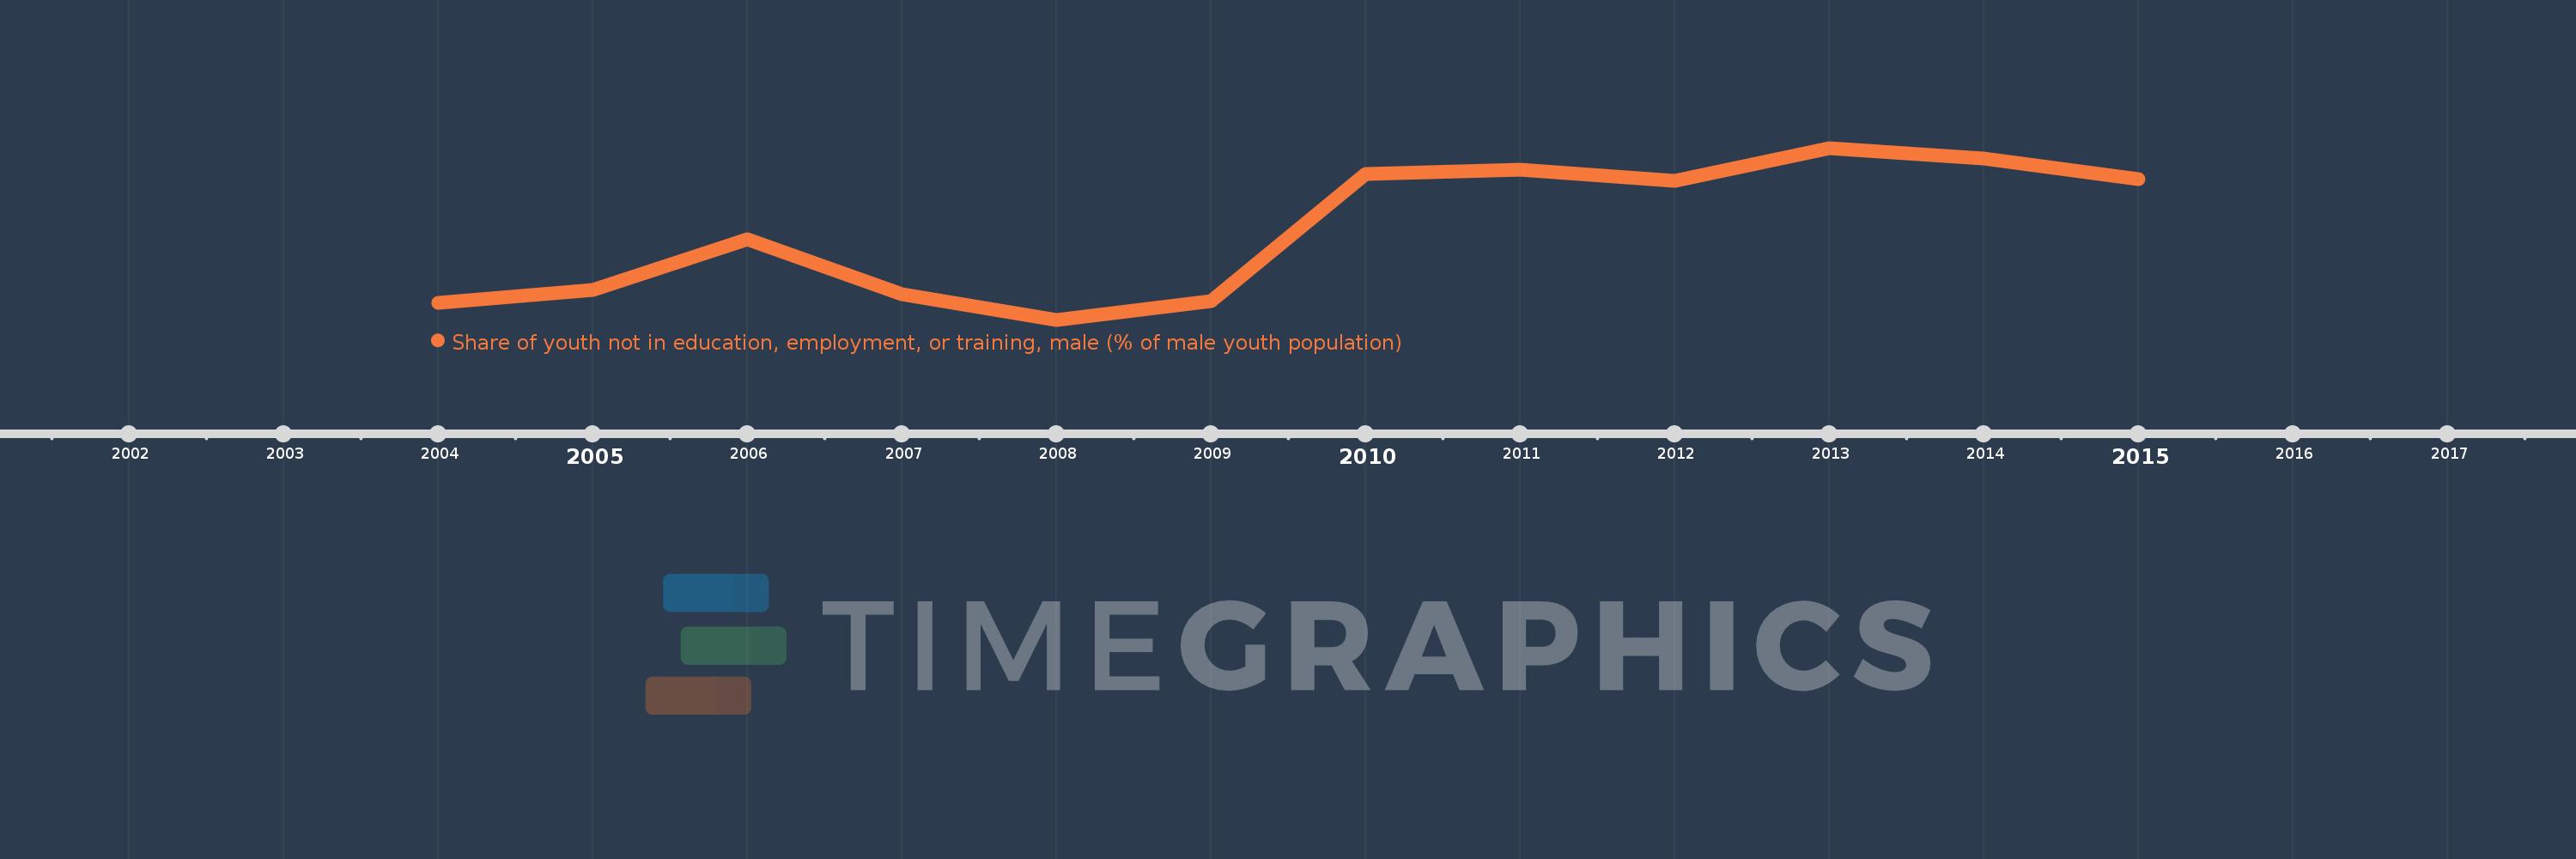
Share of youth not in education, employment, or training, male (% of male youth population)
2015,2014,2013,2012,2011,2010,2009,2008,2007,2006,2005,2004
This statistics in other country:
Timeline:
This timeline shows a graph from 2004 to 2015 of Euro area. No data until 2003. Number of actual observations by date: 12.
Source name:
World Development Indicators
Source organization:
International Labour Organization, Key Indicators of the Labour Market database.
Categories, topics:
Social Protection & Labor
Last updated:
apr 23, 2017
Indicators value changes by year
Maximum:
12.997
jan 1, 2013
At the date of observation
Value
Absolute change
Change from previous value
jan 1, 2004
10.153
+10.153
0.0%
jan 1, 2005
10.393
+0.24
2.37%
jan 1, 2006
11.317
+0.924
8.89%
jan 1, 2007
10.308
-1.009
-8.92%
jan 1, 2008
9.842
-0.466
-4.52%
jan 1, 2009
10.188
+0.346
3.52%
jan 1, 2010
12.525
+2.338
22.95%
jan 1, 2011
12.597
+0.072
0.57%
jan 1, 2012
12.392
-0.205
-1.63%
jan 1, 2013
12.997
+0.605
4.88%
jan 1, 2014
12.797
-0.2
-1.54%
jan 1, 2015
12.427
-0.37
-2.89%
Ranking of countries by current statistics by years


Comments: