29
/
en
AIzaSyAYiBZKx7MnpbEhh9jyipgxe19OcubqV5w
April 1, 2024
50679
Middle income
MIC
false
2
1
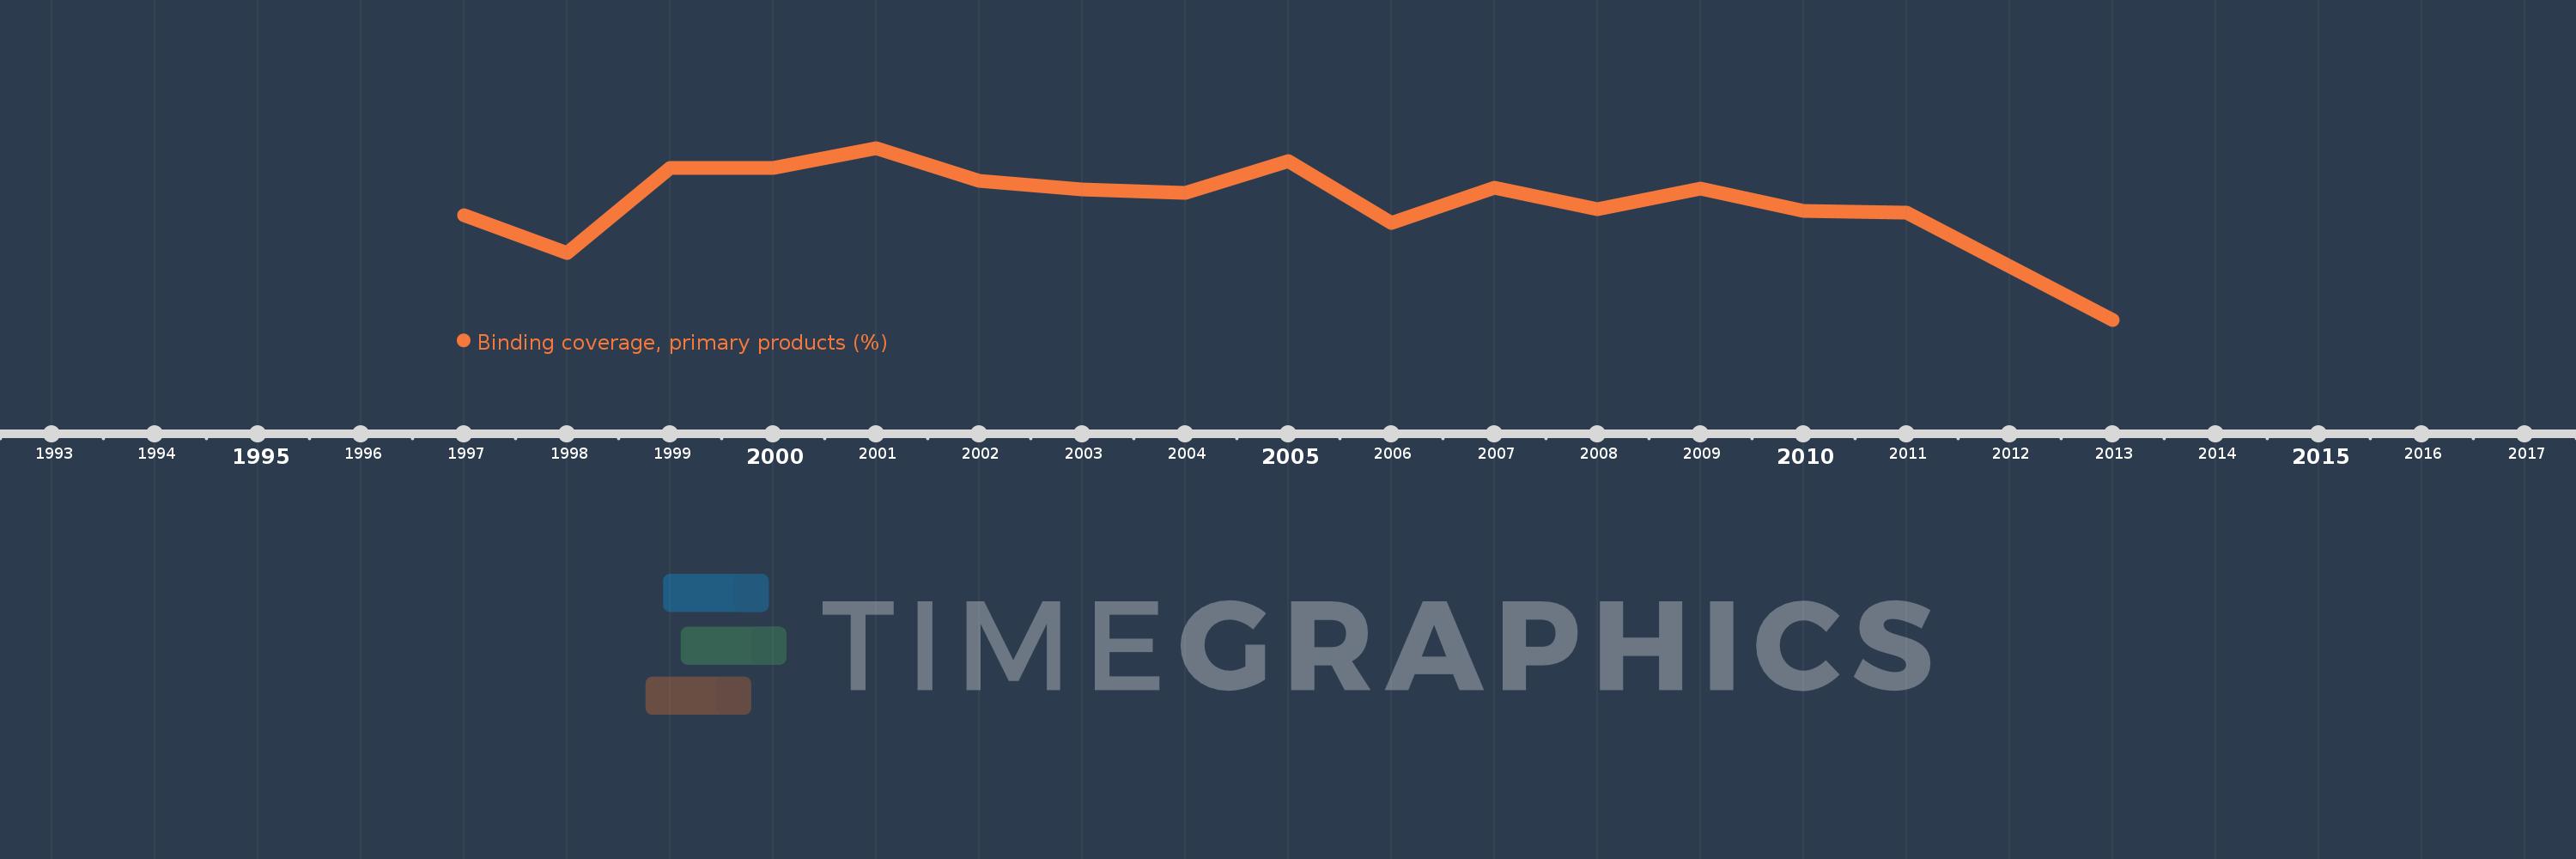
Binding coverage, primary products (%)
2013,2011,2010,2009,2008,2007,2006,2005,2004,2003,2002,2001,2000,1999,1998,1997
This statistics in other country:
Timeline:
This timeline shows a graph from 1997 to 2013 of Middle income. No data until 1996. Number of actual observations by date: 16.
Source name:
World Development Indicators
Source organization:
World Bank staff estimates using the World Integrated Trade Solution system, based on data from World Trade Organization.
Categories, topics:
Private Sector, Trade
Last updated:
apr 23, 2017
Indicators value changes by year
At the date of observation
Value
Absolute change
Change from previous value
jan 1, 1997
90.75
+90.75
0.0%
jan 1, 1998
88.96
-1.79
-1.97%
jan 1, 1999
92.99
+4.03
4.53%
jan 1, 2000
92.99
0.0
0.0%
jan 1, 2001
93.96
+0.97
1.04%
jan 1, 2002
92.41
-1.55
-1.65%
jan 1, 2003
91.97
-0.44
-0.48%
jan 1, 2004
91.82
-0.15
-0.16%
jan 1, 2005
93.35
+1.53
1.67%
jan 1, 2006
90.37
-2.98
-3.19%
jan 1, 2007
92.06
+1.69
1.87%
jan 1, 2008
91.04
-1.02
-1.11%
jan 1, 2009
92.02
+0.98
1.08%
jan 1, 2010
90.97
-1.05
-1.14%
jan 1, 2011
90.88
-0.09
-0.1%
jan 1, 2013
85.77
-5.11
-5.62%
Ranking of countries by current statistics by years


Comments: