29
/
en
AIzaSyAYiBZKx7MnpbEhh9jyipgxe19OcubqV5w
April 1, 2024
35561
High income
HIC
false
2
1
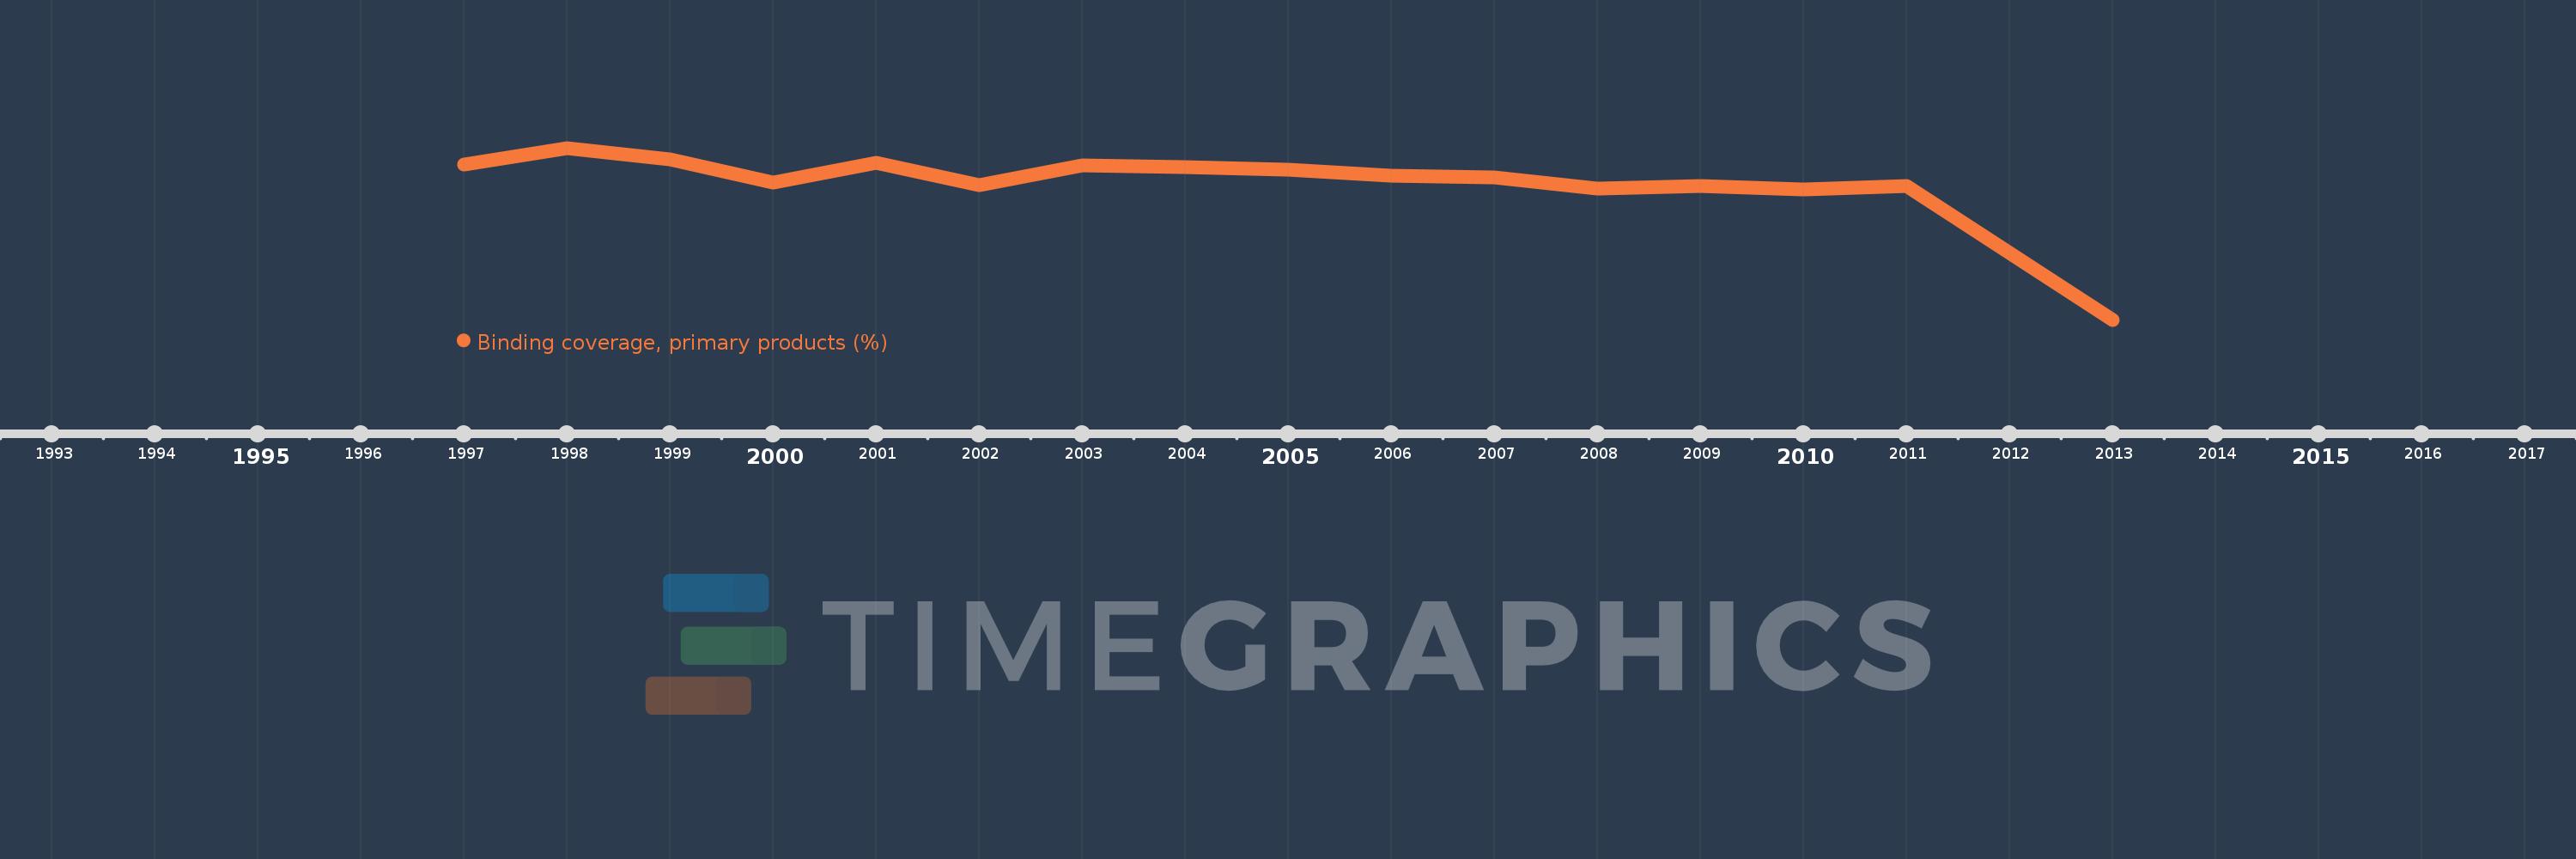
Binding coverage, primary products (%)
2013,2011,2010,2009,2008,2007,2006,2005,2004,2003,2002,2001,2000,1999,1998,1997
This statistics in other country:
Timeline:
This timeline shows a graph from 1997 to 2013 of High income. No data until 1996. Number of actual observations by date: 16.
Source name:
World Development Indicators
Source organization:
World Bank staff estimates using the World Integrated Trade Solution system, based on data from World Trade Organization.
Categories, topics:
Private Sector, Trade
Last updated:
apr 23, 2017
Indicators value changes by year
At the date of observation
Value
Absolute change
Change from previous value
jan 1, 1997
97.47
+97.47
0.0%
jan 1, 1998
99.39
+1.92
1.97%
jan 1, 1999
98.11
-1.28
-1.29%
jan 1, 2000
95.39
-2.72
-2.77%
jan 1, 2001
97.71
+2.32
2.43%
jan 1, 2002
95.18
-2.53
-2.59%
jan 1, 2003
97.35
+2.17
2.28%
jan 1, 2004
97.17
-0.18
-0.18%
jan 1, 2005
96.86
-0.31
-0.32%
jan 1, 2006
96.22
-0.64
-0.66%
jan 1, 2007
95.99
-0.23
-0.24%
jan 1, 2008
94.79
-1.2
-1.25%
jan 1, 2009
95.05
+0.26
0.27%
jan 1, 2010
94.67
-0.38
-0.4%
jan 1, 2011
95.04
+0.37
0.39%
jan 1, 2013
79.75
-15.29
-16.09%
Ranking of countries by current statistics by years


Comments: