29
/
en
AIzaSyAYiBZKx7MnpbEhh9jyipgxe19OcubqV5w
April 1, 2024
61383
Upper middle income
UMC
false
2
1
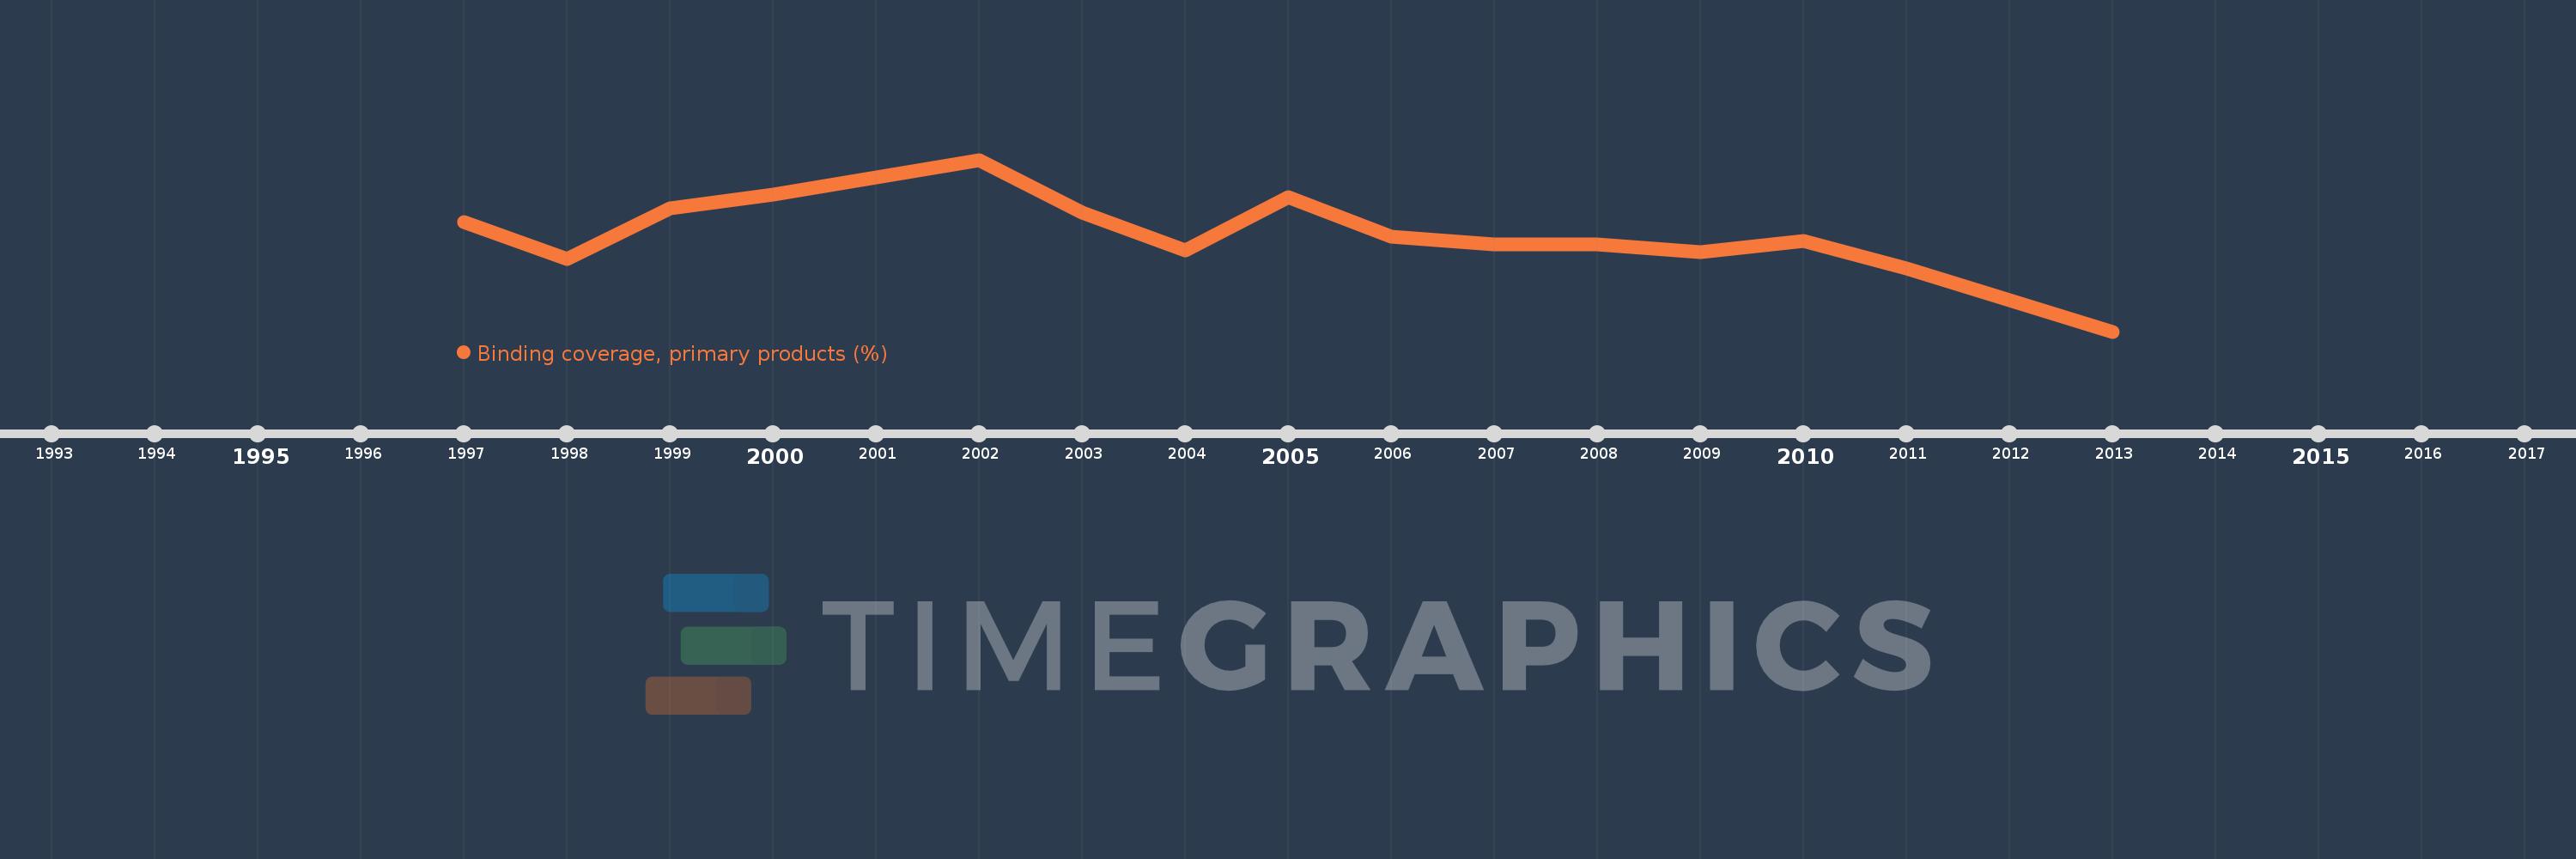
Binding coverage, primary products (%)
2013,2011,2010,2009,2008,2007,2006,2005,2004,2003,2002,2001,2000,1999,1998,1997
This statistics in other country:
Timeline:
This timeline shows a graph from 1997 to 2013 of Upper middle income. No data until 1996. Number of actual observations by date: 16.
Source name:
World Development Indicators
Source organization:
World Bank staff estimates using the World Integrated Trade Solution system, based on data from World Trade Organization.
Categories, topics:
Private Sector, Trade
Last updated:
apr 23, 2017
Indicators value changes by year
At the date of observation
Value
Absolute change
Change from previous value
jan 1, 1997
92.82
+92.82
0.0%
jan 1, 1998
90.83
-1.99
-2.14%
jan 1, 1999
93.51
+2.68
2.95%
jan 1, 2000
94.25
+0.74
0.79%
jan 1, 2001
95.16
+0.91
0.97%
jan 1, 2002
96.1
+0.94
0.99%
jan 1, 2003
93.32
-2.78
-2.89%
jan 1, 2004
91.3
-2.02
-2.16%
jan 1, 2005
94.14
+2.84
3.11%
jan 1, 2006
92.03
-2.11
-2.24%
jan 1, 2007
91.6
-0.43
-0.47%
jan 1, 2008
91.63
+0.03
0.03%
jan 1, 2009
91.2
-0.43
-0.47%
jan 1, 2010
91.8
+0.6
0.66%
jan 1, 2011
90.34
-1.46
-1.59%
jan 1, 2013
86.99
-3.35
-3.71%
Ranking of countries by current statistics by years


Comments: