29
/
en
AIzaSyAYiBZKx7MnpbEhh9jyipgxe19OcubqV5w
April 1, 2024
248369
Sri Lanka
LKA
true
2
1
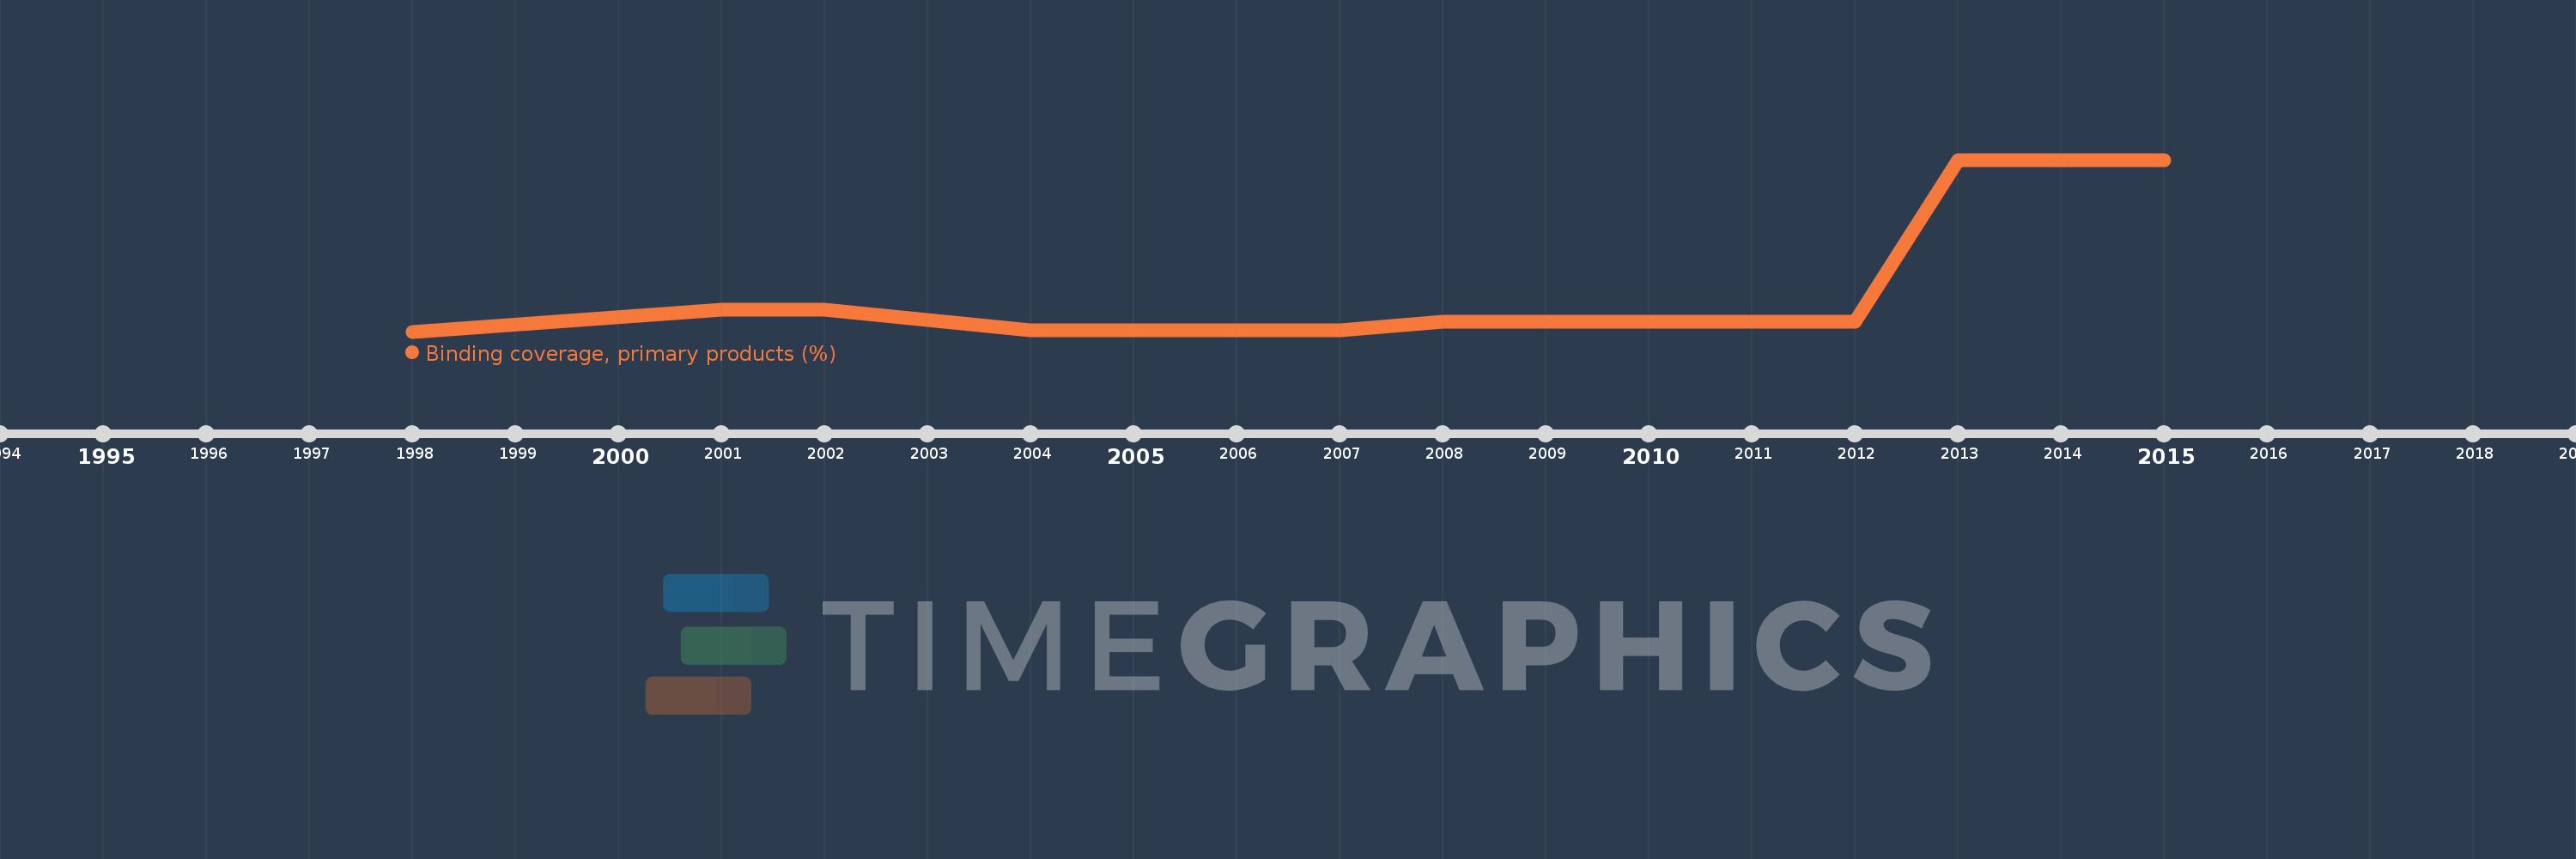
Binding coverage, primary products (%)
2015,2013,2012,2011,2010,2009,2008,2007,2006,2005,2004,2002,2001,1998
This statistics in other country:
Timeline:
This timeline shows a graph from 1998 to 2015 of Sri Lanka. No data until 1997. Number of actual observations by date: 14.
Source name:
World Development Indicators
Source organization:
World Bank staff estimates using the World Integrated Trade Solution system, based on data from World Trade Organization.
Categories, topics:
Private Sector, Trade
Last updated:
apr 23, 2017
Indicators value changes by year
At the date of observation
Value
Absolute change
Change from previous value
jan 1, 1998
69.12
+69.12
0.0%
jan 1, 2001
69.66
+0.54
0.78%
jan 1, 2002
69.66
0.0
0.0%
jan 1, 2004
69.15
-0.51
-0.73%
jan 1, 2005
69.15
0.0
0.0%
jan 1, 2006
69.15
0.0
0.0%
jan 1, 2007
69.15
0.0
0.0%
jan 1, 2008
69.37
+0.22
0.32%
jan 1, 2009
69.37
0.0
0.0%
jan 1, 2010
69.37
0.0
0.0%
jan 1, 2011
69.37
0.0
0.0%
jan 1, 2012
69.37
0.0
0.0%
jan 1, 2013
73.35
+3.98
5.74%
jan 1, 2015
73.35
0.0
0.0%
Ranking of countries by current statistics by years


Comments: