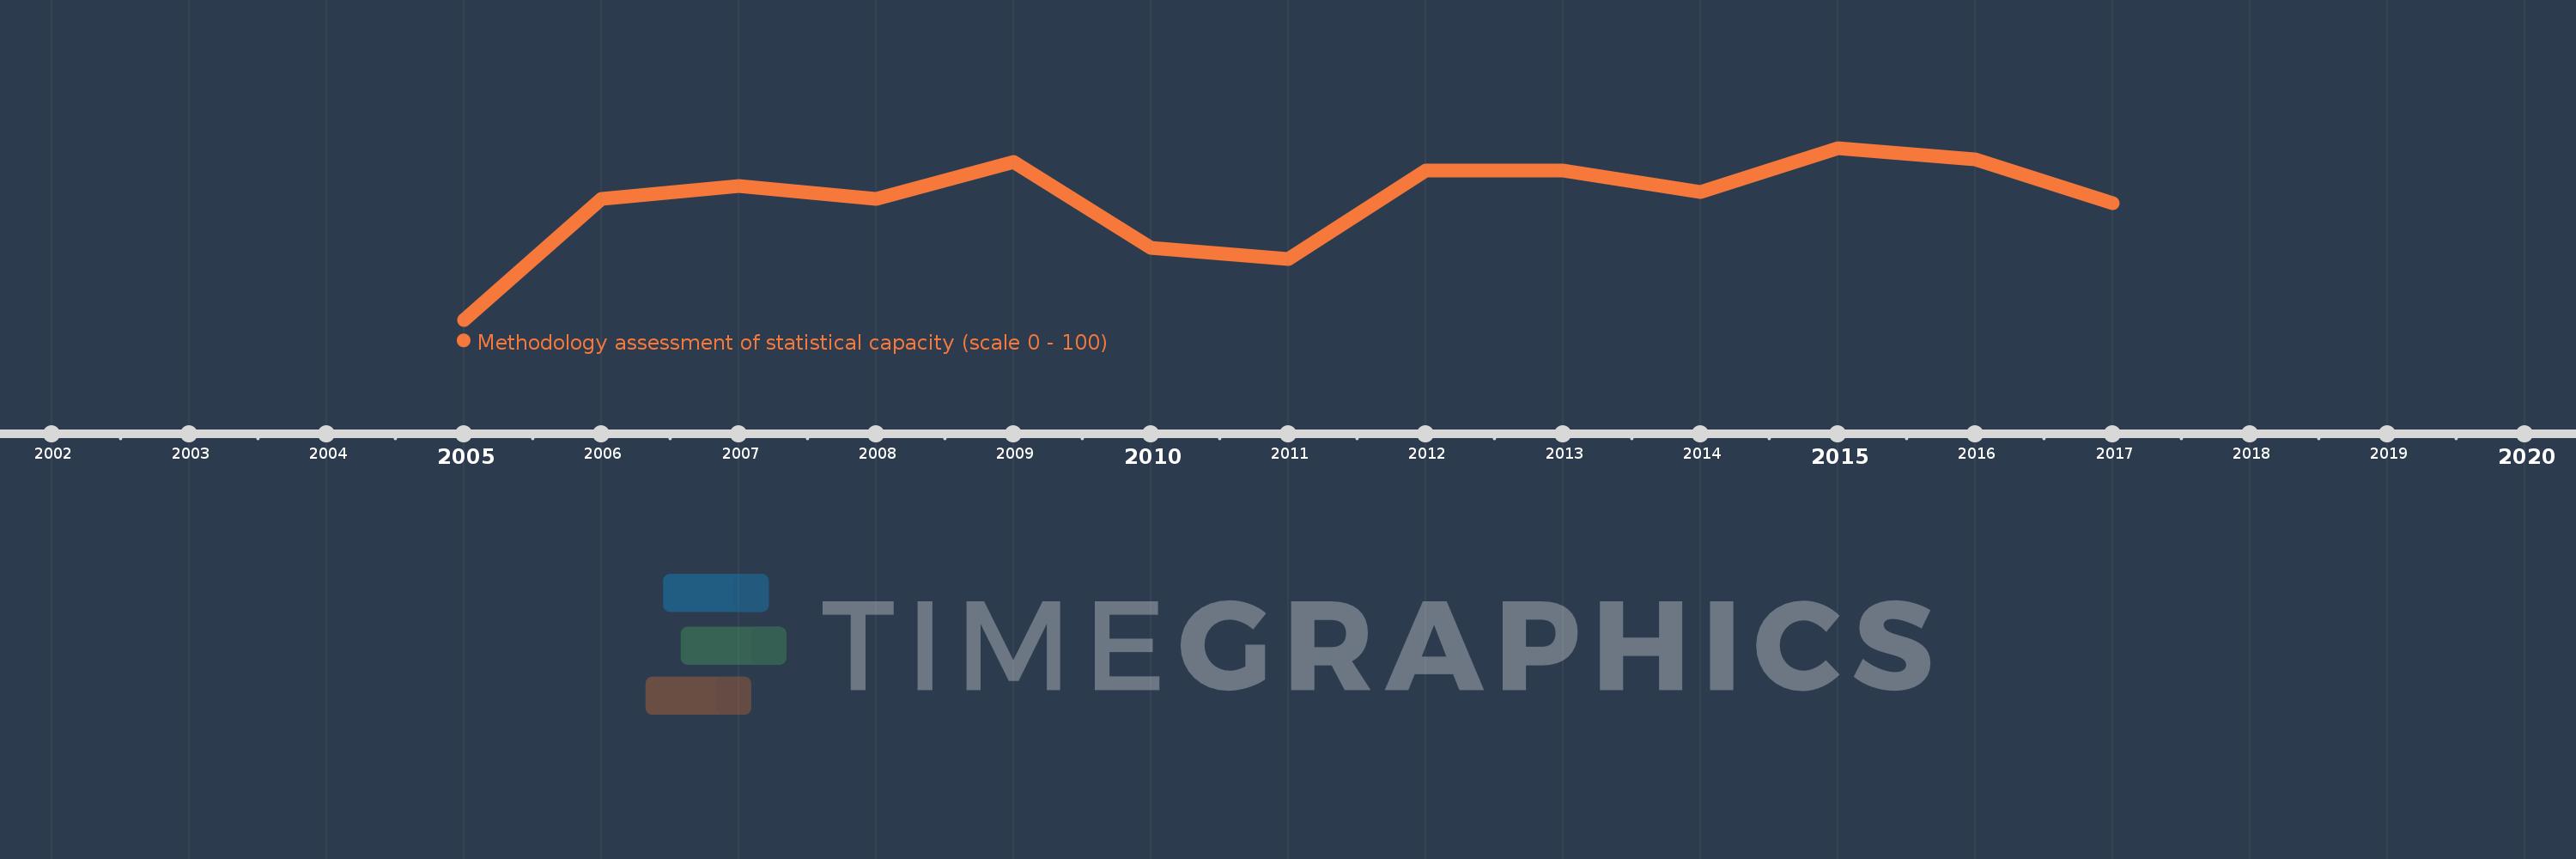
This timeline shows a graph from 2005 to 2017 of Middle East & North Africa (excluding high income). No data until 2004. Number of actual observations by date: 13.
Source name:
World Development Indicators
Source organization:
World Bank
Categories, topics:
Public Sector
Last updated:
apr 23, 2017
Indicators value changes by year
Meaning:
54.341
Minimum:
45.455
jan 1, 2005
Maximum:
58.333
jan 1, 2015
At the date of observation
Value
Absolute change
Change from the previous value
jan 1, 2005
45.455
+45.455
0.0%
jan 1, 2006
54.545
+9.091
20.0%
jan 1, 2007
55.455
+0.909
1.67%
jan 1, 2008
54.545
-0.909
-1.64%
jan 1, 2009
57.273
+2.727
5.0%
jan 1, 2010
50.833
-6.439
-11.24%
jan 1, 2011
50.0
-0.833
-1.64%
jan 1, 2012
56.667
+6.667
13.33%
jan 1, 2013
56.667
0.0
0.0%
jan 1, 2014
55.0
-1.667
-2.94%
jan 1, 2015
58.333
+3.333
6.06%
jan 1, 2016
57.5
-0.833
-1.43%
jan 1, 2017
54.167
-3.333
-5.8%
Ranking of countries by current statistics by years
