29
/
en
AIzaSyAYiBZKx7MnpbEhh9jyipgxe19OcubqV5w
April 1, 2024
43660
Latin America & the Caribbean (IDA & IBRD countries)
TLA
false
2
1
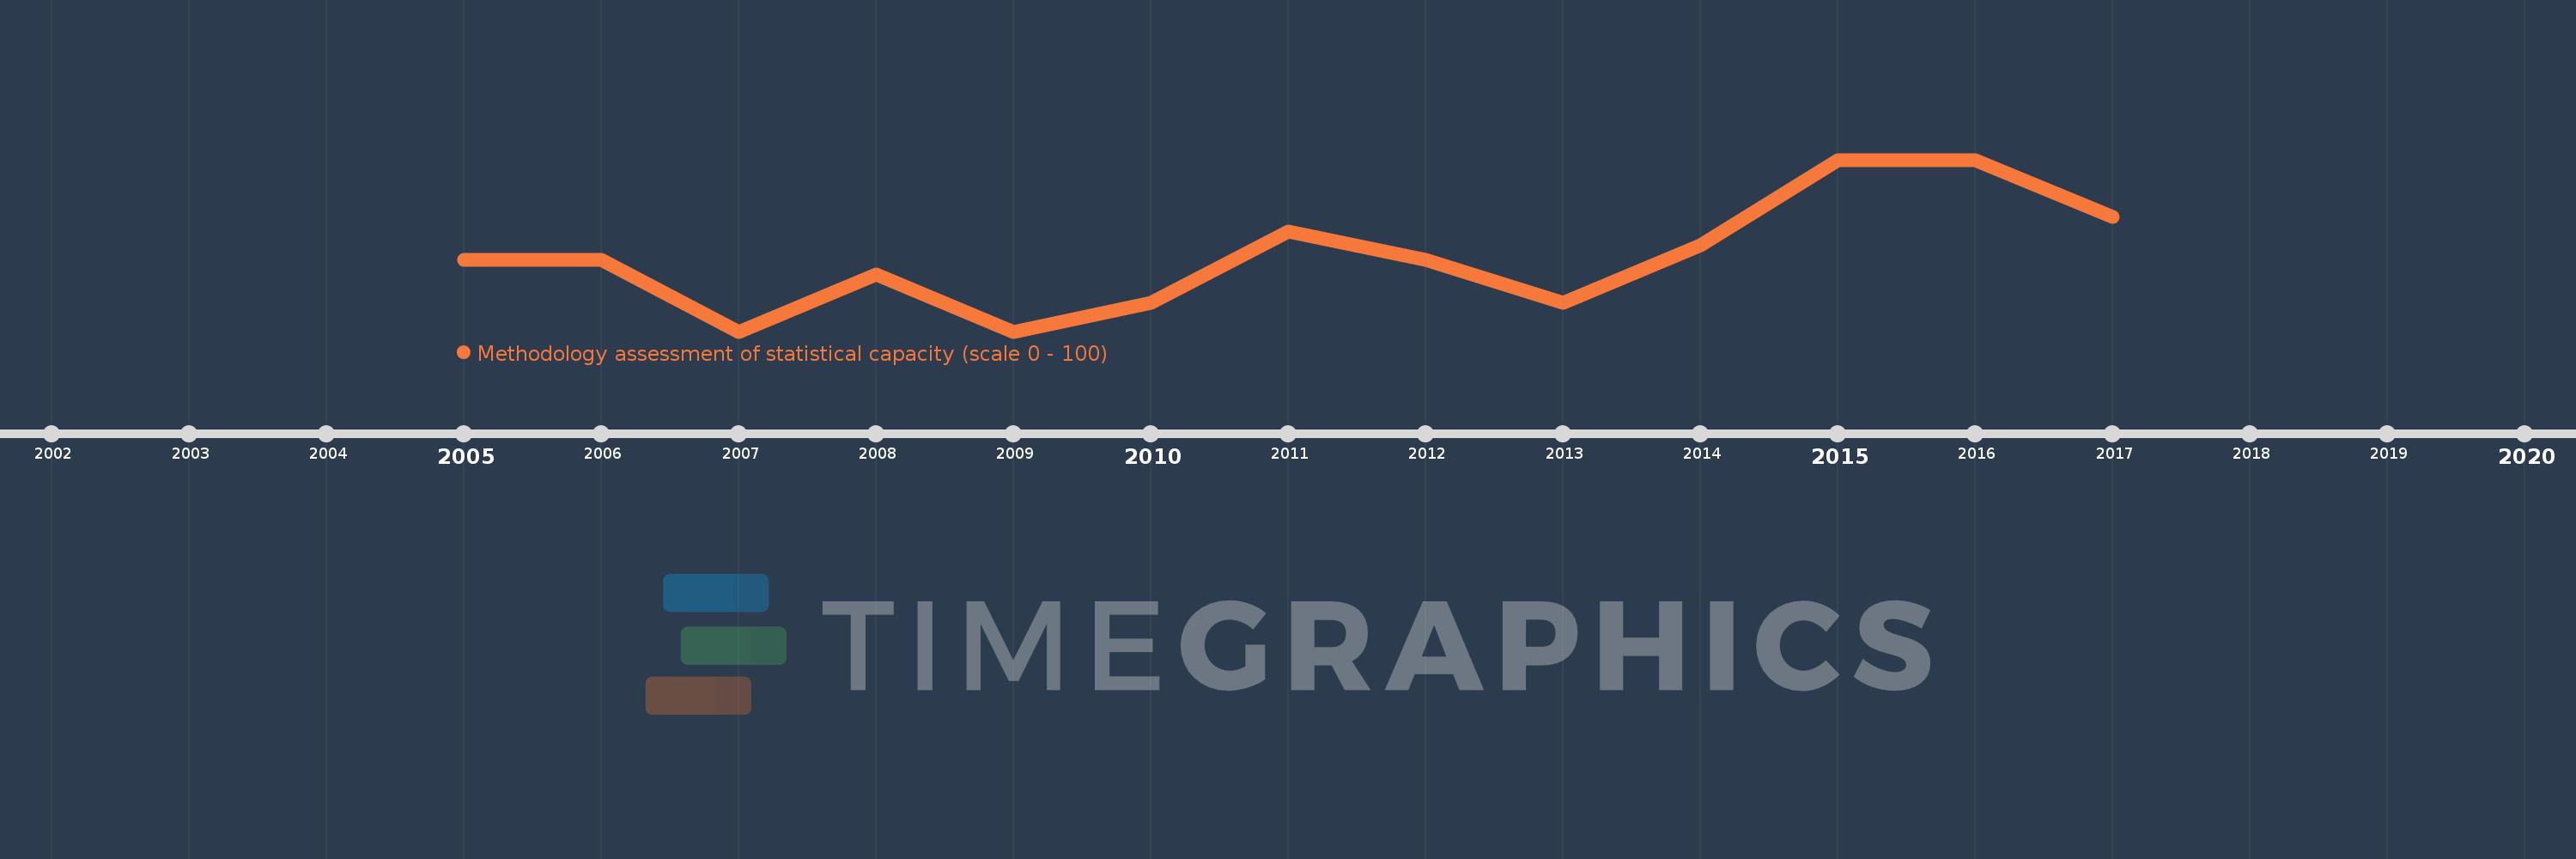
Methodology assessment of statistical capacity (scale 0 - 100)
2017,2016,2015,2014,2013,2012,2011,2010,2009,2008,2007,2006,2005
This statistics in other country:
Timeline:
This timeline shows a graph from 2005 to 2017 of Latin America & the Caribbean (IDA & IBRD countries). No data until 2004. Number of actual observations by date: 13.
Source name:
World Development Indicators
Source organization:
World Bank
Categories, topics:
Public Sector
Last updated:
apr 23, 2017
Indicators value changes by year
Maximum:
71.905
jan 1, 2015
At the date of observation
Value
Absolute change
Change from previous value
jan 1, 2005
68.571
+68.571
0.0%
jan 1, 2006
68.571
0.0
0.0%
jan 1, 2007
66.19
-2.381
-3.47%
jan 1, 2008
68.095
+1.905
2.88%
jan 1, 2009
66.19
-1.905
-2.8%
jan 1, 2010
67.143
+0.952
1.44%
jan 1, 2011
69.524
+2.381
3.55%
jan 1, 2012
68.571
-0.952
-1.37%
jan 1, 2013
67.143
-1.429
-2.08%
jan 1, 2014
69.048
+1.905
2.84%
jan 1, 2015
71.905
+2.857
4.14%
jan 1, 2016
71.905
0.0
0.0%
jan 1, 2017
70.0
-1.905
-2.65%
Ranking of countries by current statistics by years


Comments: