29
/
en
AIzaSyAYiBZKx7MnpbEhh9jyipgxe19OcubqV5w
April 1, 2024
38365
IDA blend
IDB
false
2
1
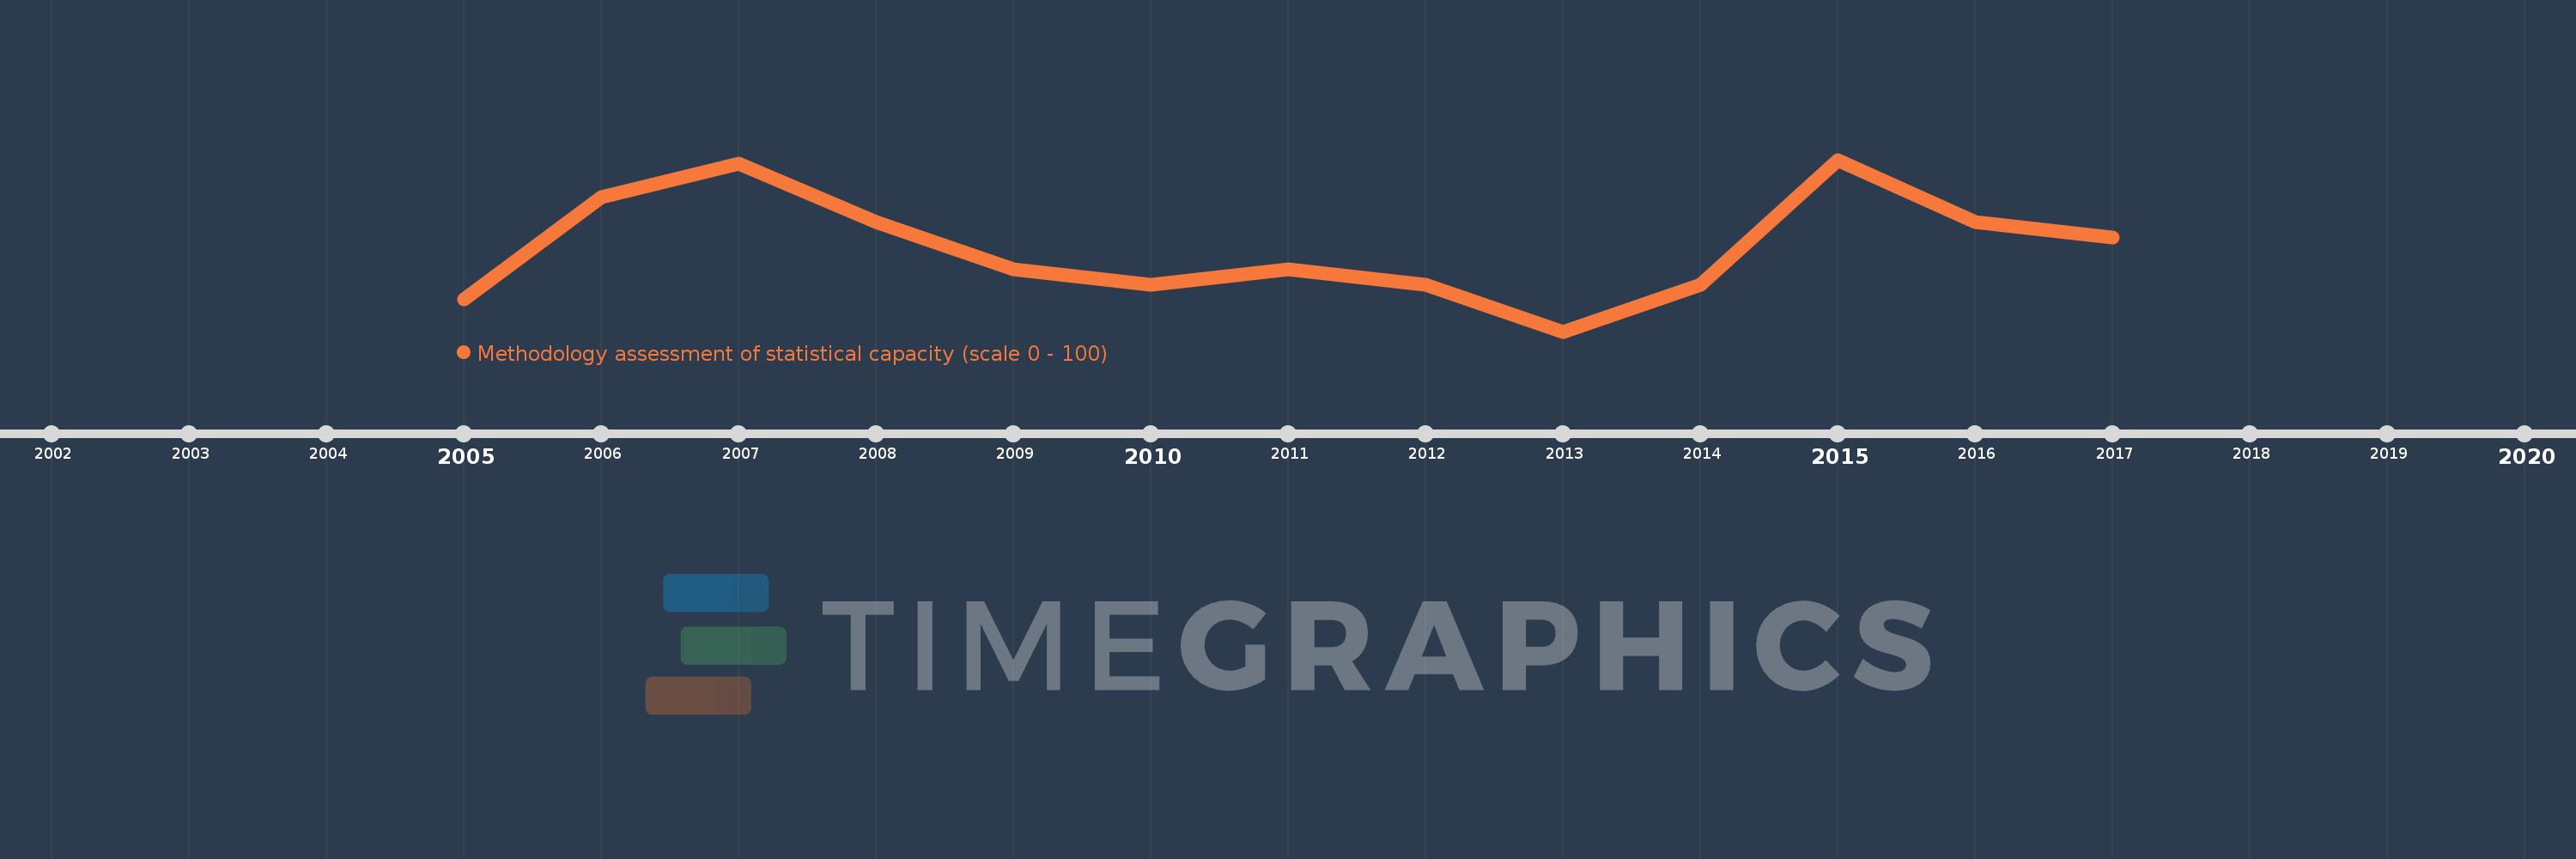
Methodology assessment of statistical capacity (scale 0 - 100)
2017,2016,2015,2014,2013,2012,2011,2010,2009,2008,2007,2006,2005
This statistics in other country:
Timeline:
This timeline shows a graph from 2005 to 2017 of IDA blend. No data until 2004. Number of actual observations by date: 13.
Source name:
World Development Indicators
Source organization:
World Bank
Categories, topics:
Public Sector
Last updated:
apr 23, 2017
Indicators value changes by year
Minimum:
49.231
jan 1, 2013
Maximum:
57.692
jan 1, 2015
At the date of observation
Value
Absolute change
Change from previous value
jan 1, 2005
50.833
+50.833
0.0%
jan 1, 2006
55.833
+5.0
9.84%
jan 1, 2007
57.5
+1.667
2.99%
jan 1, 2008
54.615
-2.885
-5.02%
jan 1, 2009
52.308
-2.308
-4.23%
jan 1, 2010
51.538
-0.769
-1.47%
jan 1, 2011
52.308
+0.769
1.49%
jan 1, 2012
51.538
-0.769
-1.47%
jan 1, 2013
49.231
-2.308
-4.48%
jan 1, 2014
51.538
+2.308
4.69%
jan 1, 2015
57.692
+6.154
11.94%
jan 1, 2016
54.615
-3.077
-5.33%
jan 1, 2017
53.846
-0.769
-1.41%
Ranking of countries by current statistics by years


Comments: