29
/
en
AIzaSyAYiBZKx7MnpbEhh9jyipgxe19OcubqV5w
April 1, 2024
36784
IBRD only
IBD
false
2
1
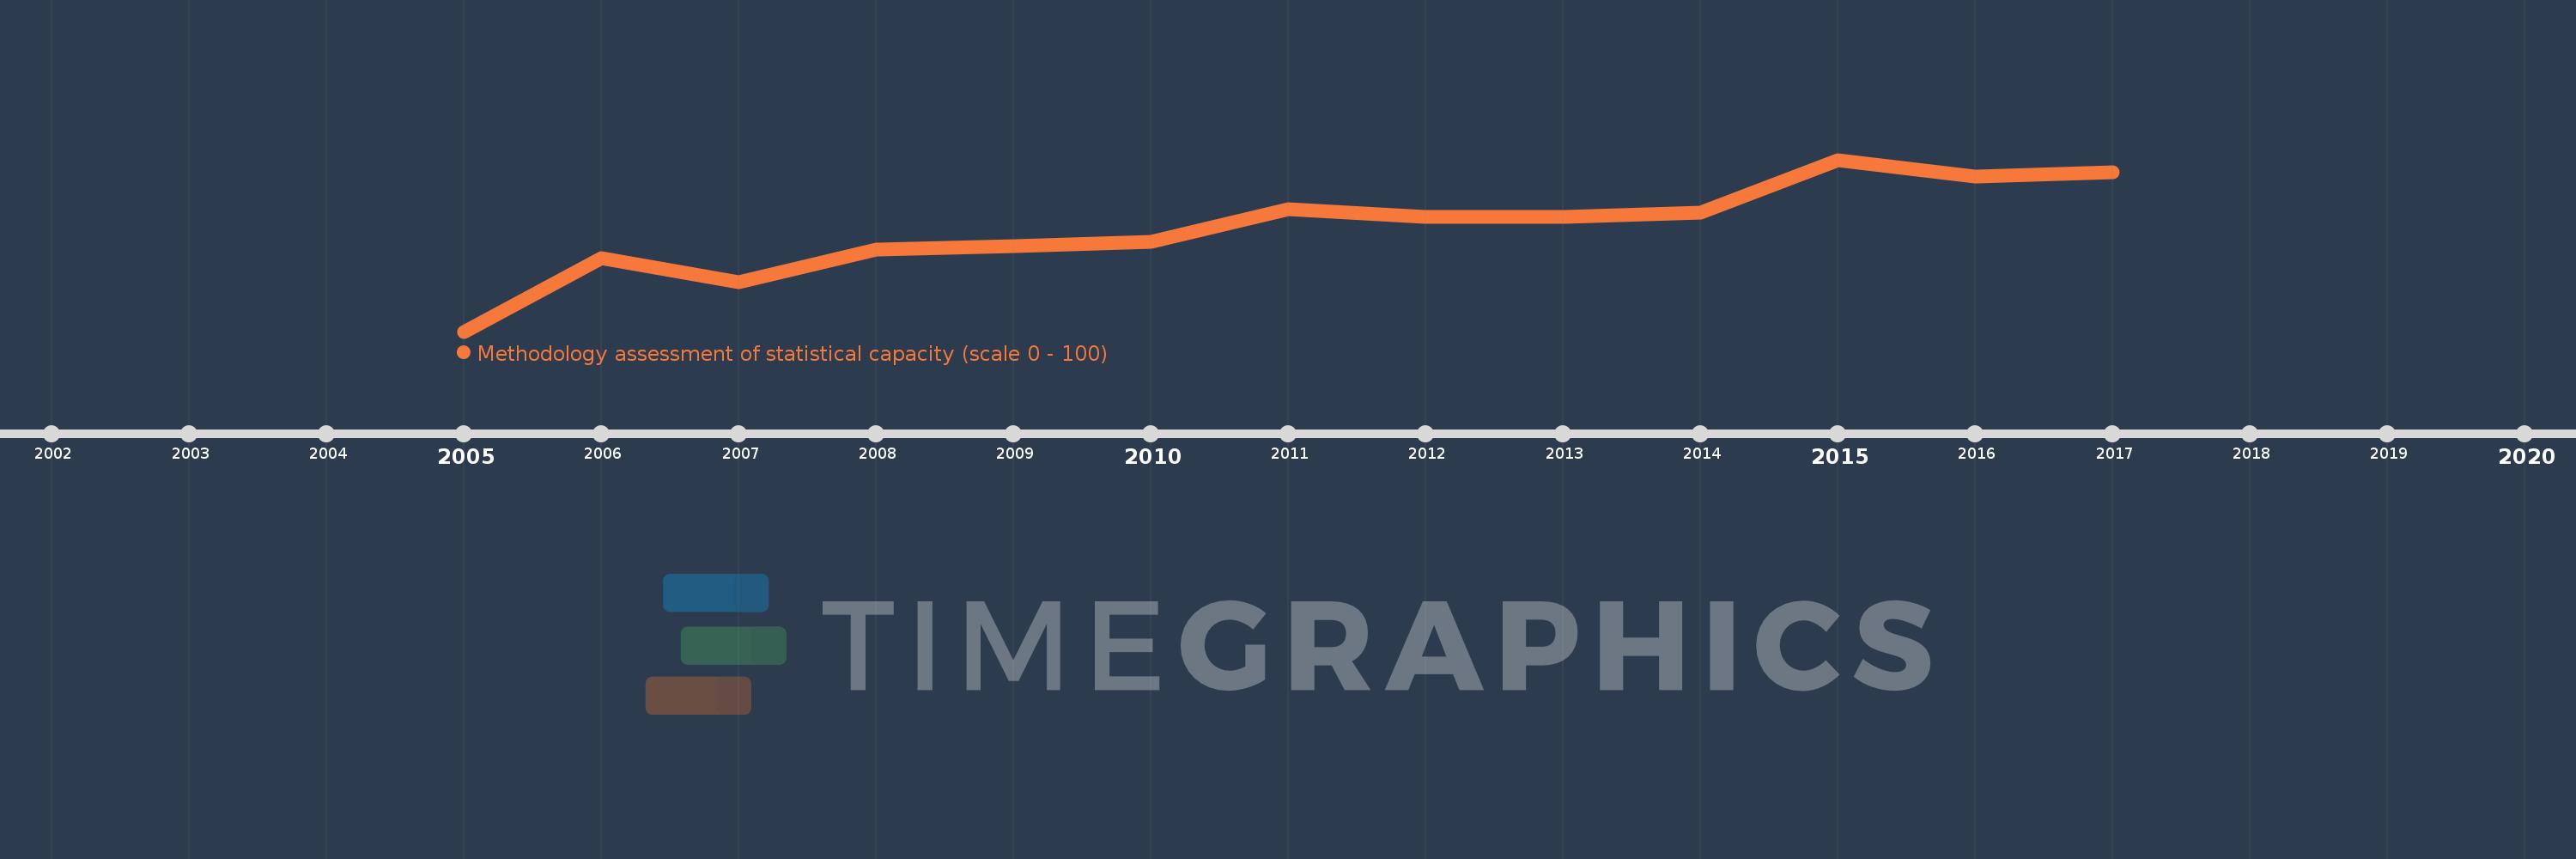
Methodology assessment of statistical capacity (scale 0 - 100)
2017,2016,2015,2014,2013,2012,2011,2010,2009,2008,2007,2006,2005
This statistics in other country:
Timeline:
This timeline shows a graph from 2005 to 2017 of IBRD only. No data until 2004. Number of actual observations by date: 13.
Source name:
World Development Indicators
Source organization:
World Bank
Categories, topics:
Public Sector
Last updated:
apr 23, 2017
Indicators value changes by year
Minimum:
64.464
jan 1, 2005
Maximum:
71.964
jan 1, 2015
At the date of observation
Value
Absolute change
Change from previous value
jan 1, 2005
64.464
+64.464
0.0%
jan 1, 2006
67.679
+3.214
4.99%
jan 1, 2007
66.607
-1.071
-1.58%
jan 1, 2008
68.036
+1.429
2.14%
jan 1, 2009
68.214
+0.179
0.26%
jan 1, 2010
68.393
+0.179
0.26%
jan 1, 2011
69.821
+1.429
2.09%
jan 1, 2012
69.464
-0.357
-0.51%
jan 1, 2013
69.464
0.0
0.0%
jan 1, 2014
69.643
+0.179
0.26%
jan 1, 2015
71.964
+2.321
3.33%
jan 1, 2016
71.25
-0.714
-0.99%
jan 1, 2017
71.429
+0.179
0.25%
Ranking of countries by current statistics by years


Comments: