29
/
en
AIzaSyAYiBZKx7MnpbEhh9jyipgxe19OcubqV5w
April 1, 2024
41609
Latin America & Caribbean
LCN
false
2
1
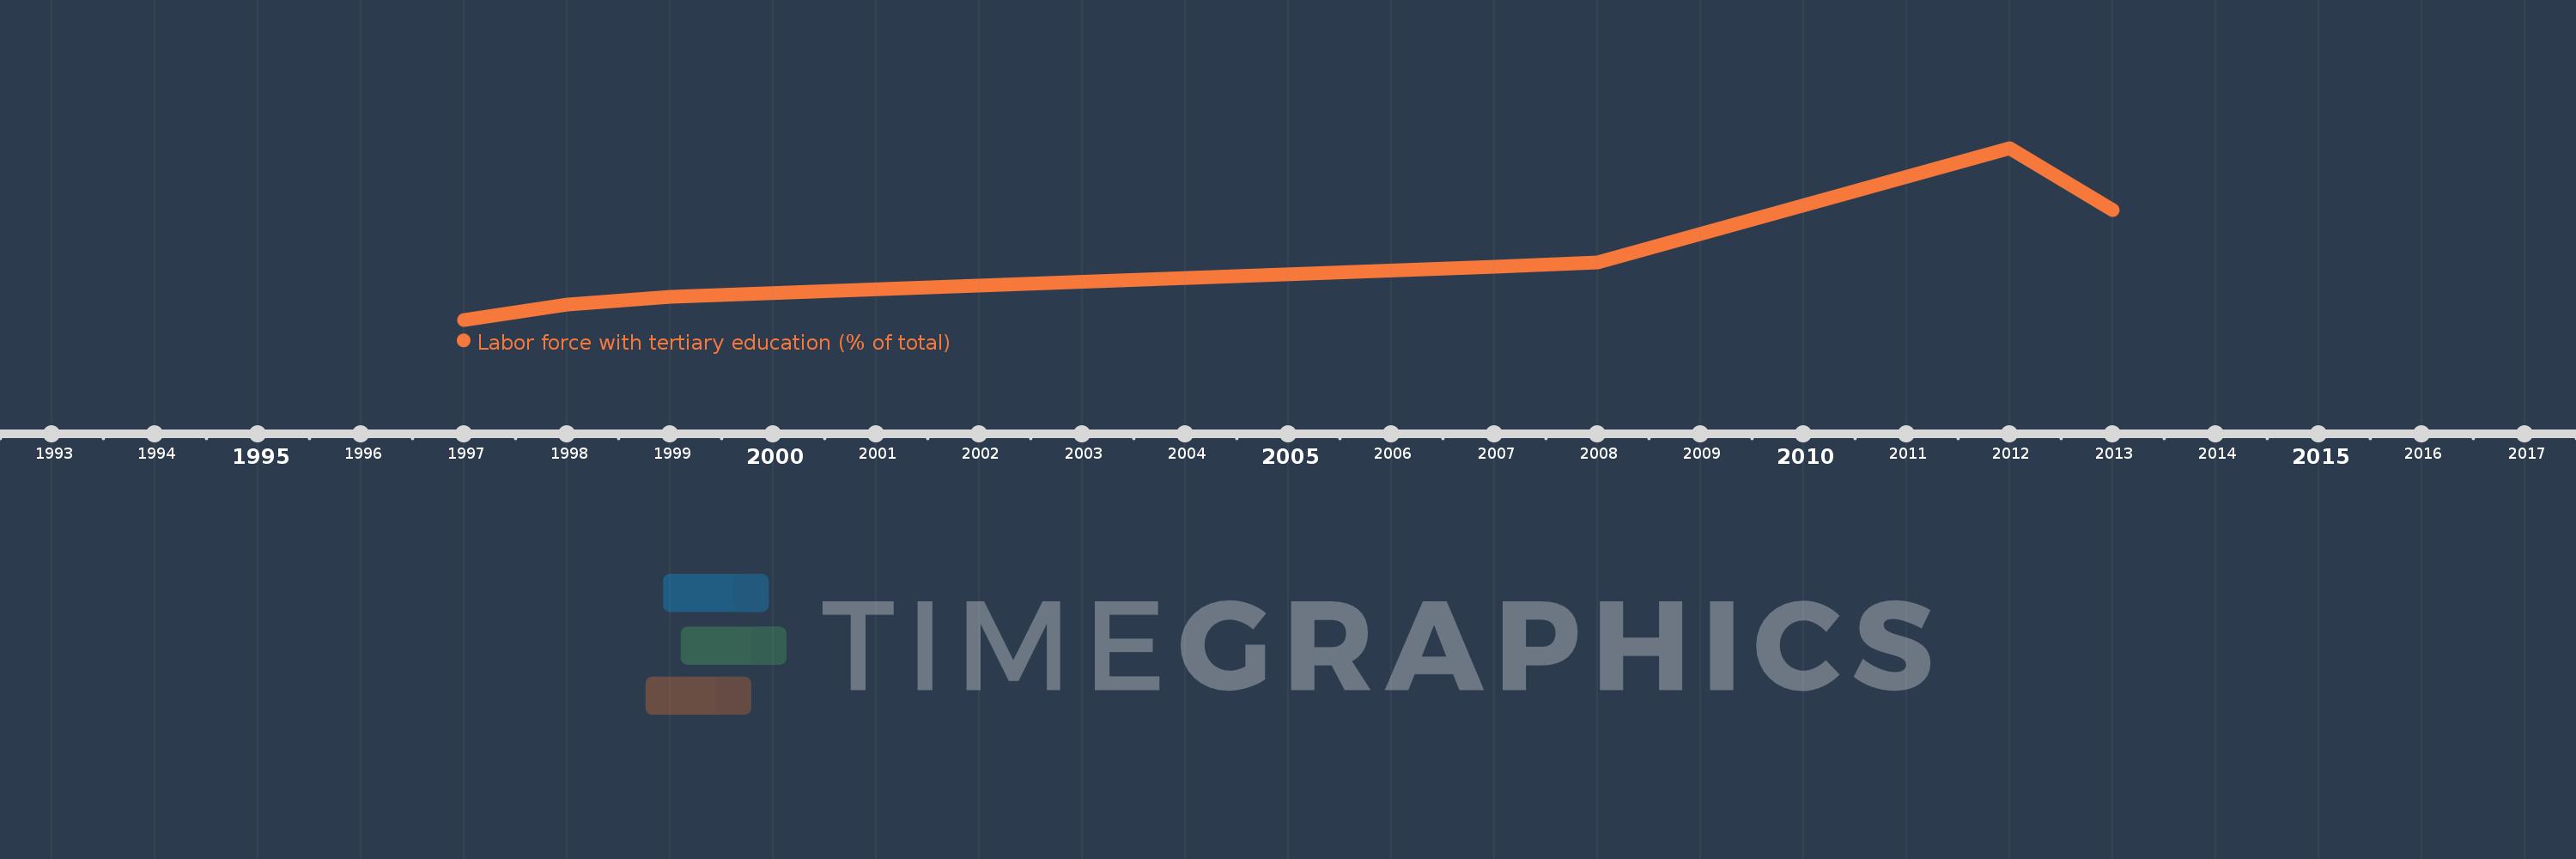
Labor force with tertiary education (% of total)
2013,2012,2008,2007,1999,1998,1997
This statistics in other country:
Timeline:
This timeline shows a graph from 1997 to 2013 of Latin America & Caribbean . No data until 1996. Number of actual observations by date: 7.
Source name:
World Development Indicators
Source organization:
International Labour Organization, Key Indicators of the Labour Market database.
Categories, topics:
Education, Social Protection & Labor
Last updated:
apr 23, 2017
Indicators value changes by year
Minimum:
11.504
jan 1, 1997
Maximum:
20.542
jan 1, 2012
At the date of observation
Value
Absolute change
Change from previous value
jan 1, 1997
11.504
+11.504
0.0%
jan 1, 1998
12.304
+0.8
6.95%
jan 1, 1999
12.732
+0.427
3.47%
jan 1, 2007
14.313
+1.581
12.42%
jan 1, 2008
14.525
+0.212
1.48%
jan 1, 2012
20.542
+6.018
41.43%
jan 1, 2013
17.278
-3.264
-15.89%
Ranking of countries by current statistics by years


Comments: