29
/
en
AIzaSyAYiBZKx7MnpbEhh9jyipgxe19OcubqV5w
April 1, 2024
32760
Europe & Central Asia (IDA & IBRD countries)
TEC
false
2
1
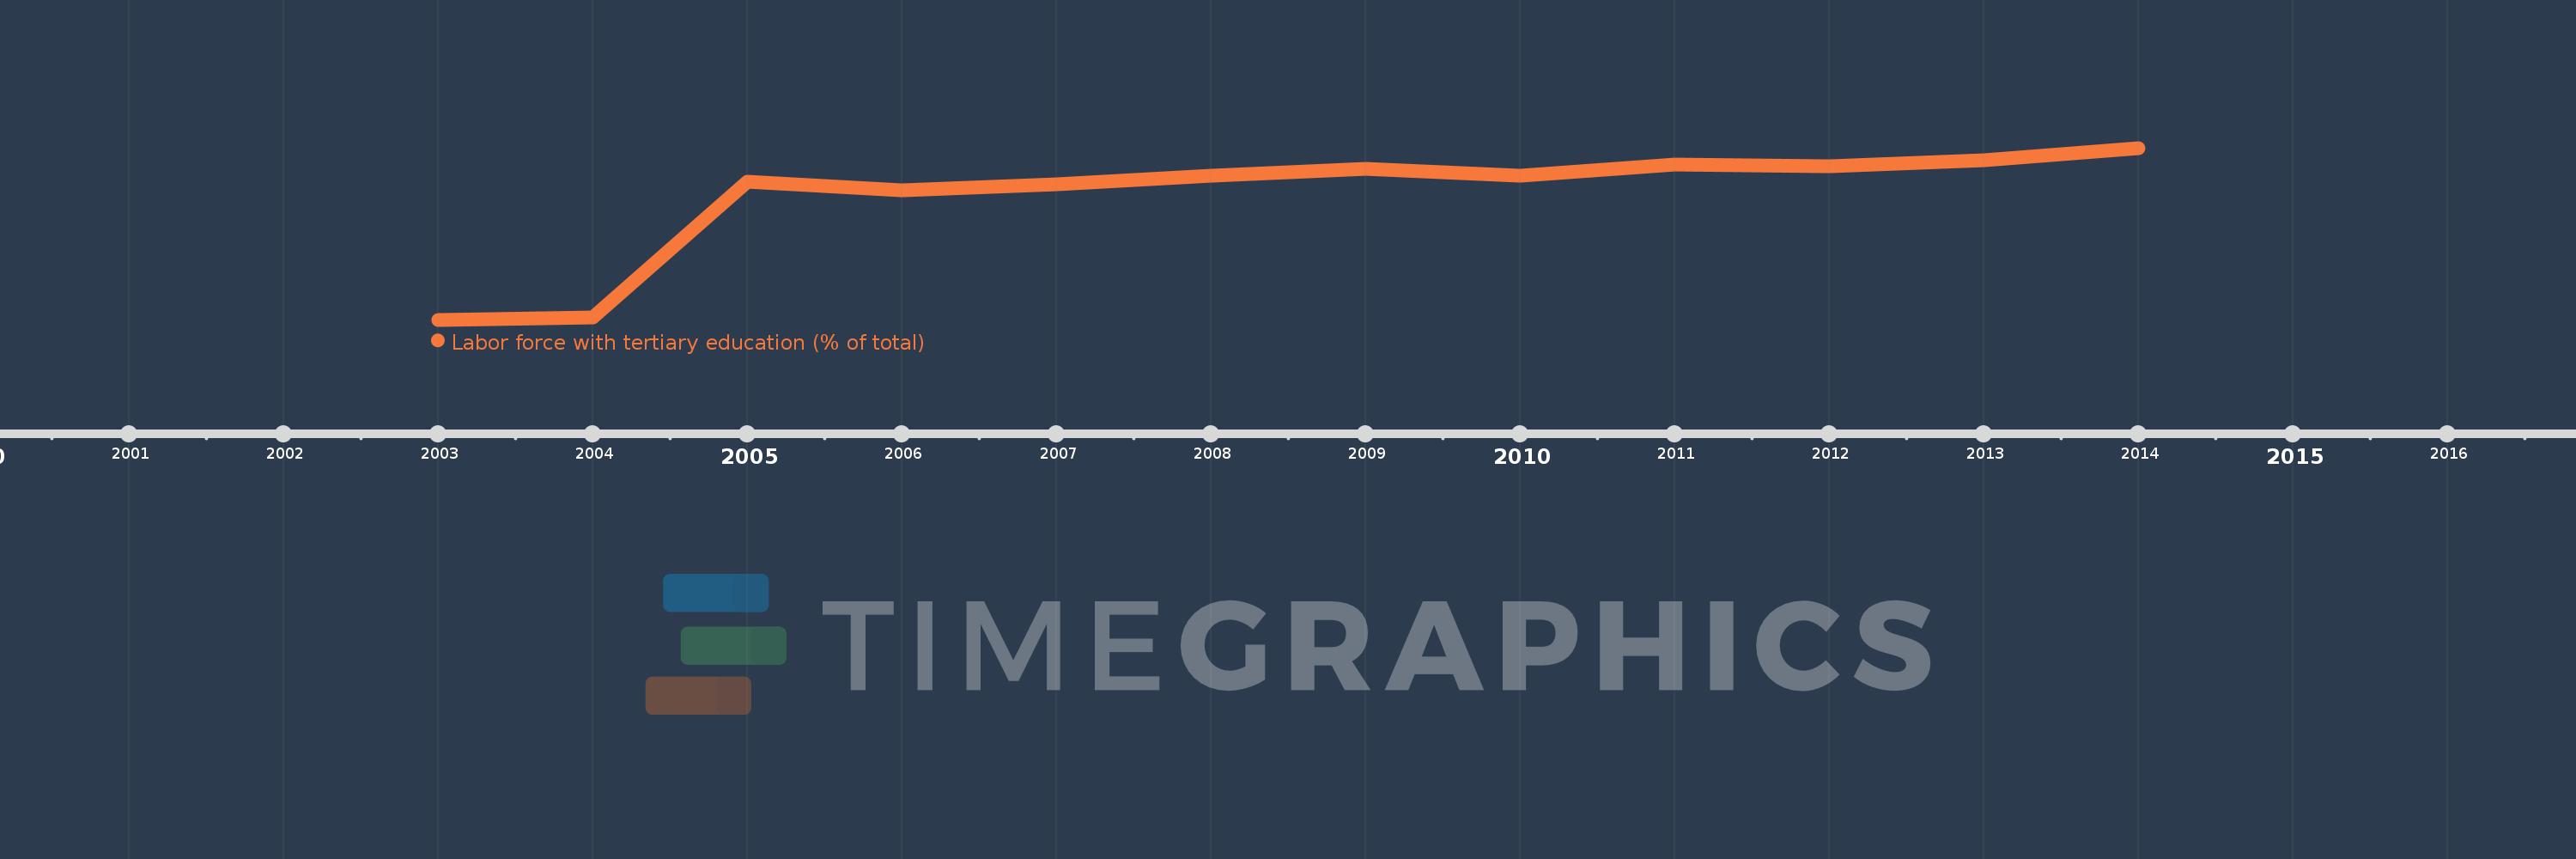
Labor force with tertiary education (% of total)
2014,2013,2012,2011,2010,2009,2008,2007,2006,2005,2004,2003
This statistics in other country:
Timeline:
This timeline shows a graph from 2003 to 2014 of Europe & Central Asia (IDA & IBRD countries). No data until 2002. Number of actual observations by date: 12.
Source name:
World Development Indicators
Source organization:
International Labour Organization, Key Indicators of the Labour Market database.
Categories, topics:
Education, Social Protection & Labor
Last updated:
apr 23, 2017
Indicators value changes by year
Minimum:
20.984
jan 1, 2003
At the date of observation
Value
Absolute change
Change from previous value
jan 1, 2003
20.984
+20.984
0.0%
jan 1, 2004
21.21
+0.226
1.08%
jan 1, 2005
35.567
+14.357
67.69%
jan 1, 2006
34.637
-0.93
-2.61%
jan 1, 2007
35.315
+0.678
1.96%
jan 1, 2008
36.235
+0.92
2.6%
jan 1, 2009
36.912
+0.678
1.87%
jan 1, 2010
36.18
-0.732
-1.98%
jan 1, 2011
37.406
+1.226
3.39%
jan 1, 2012
37.147
-0.259
-0.69%
jan 1, 2013
37.868
+0.721
1.94%
jan 1, 2014
39.12
+1.251
3.3%
Ranking of countries by current statistics by years


Comments: