29
/
en
AIzaSyAYiBZKx7MnpbEhh9jyipgxe19OcubqV5w
April 1, 2024
30831
Europe & Central Asia
ECS
false
2
1
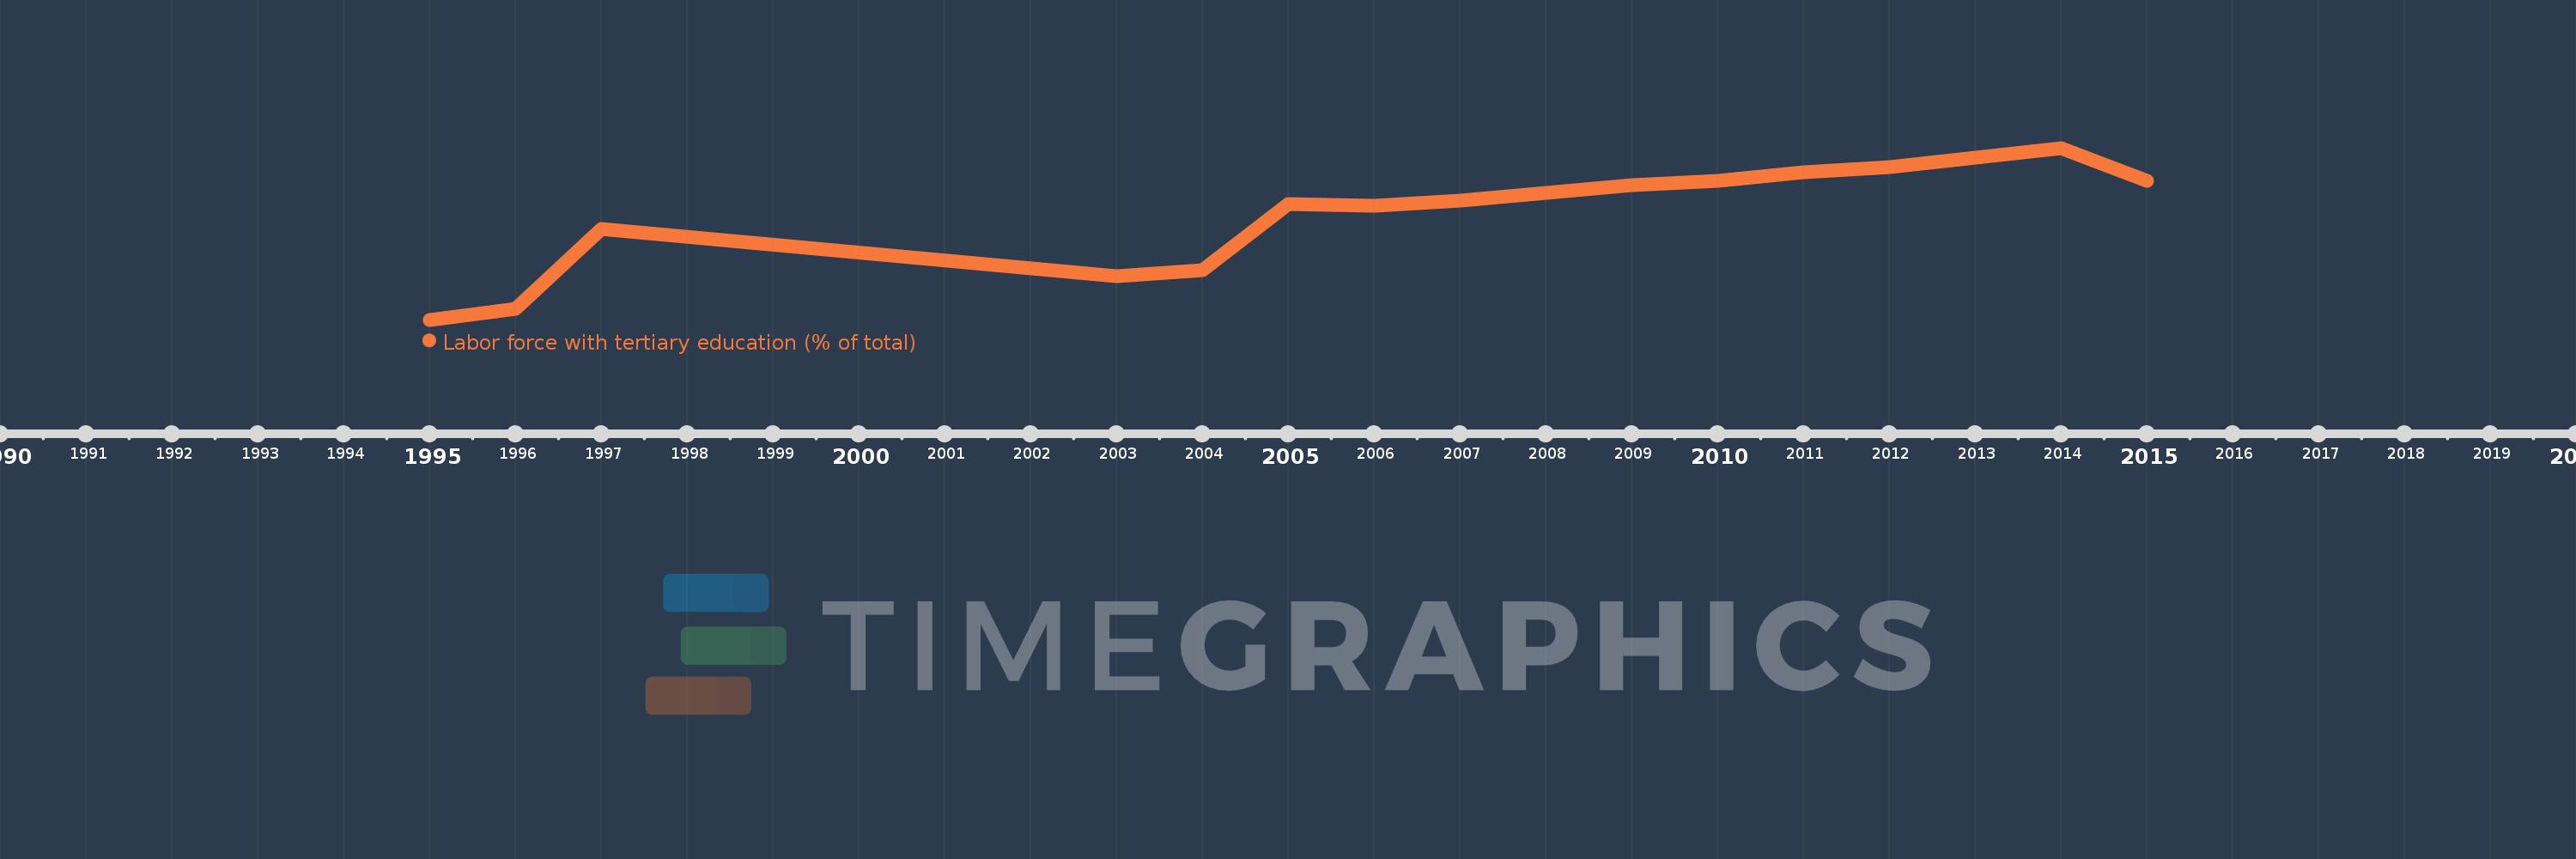
Labor force with tertiary education (% of total)
2015,2014,2013,2012,2011,2010,2009,2008,2007,2006,2005,2004,2003,1997,1996,1995
This statistics in other country:
Timeline:
This timeline shows a graph from 1995 to 2015 of Europe & Central Asia. No data until 1994. Number of actual observations by date: 16.
Source name:
World Development Indicators
Source organization:
International Labour Organization, Key Indicators of the Labour Market database.
Categories, topics:
Education, Social Protection & Labor
Last updated:
apr 23, 2017
Indicators value changes by year
Minimum:
17.716
jan 1, 1995
Maximum:
34.695
jan 1, 2014
At the date of observation
Value
Absolute change
Change from previous value
jan 1, 1995
17.716
+17.716
0.0%
jan 1, 1996
18.832
+1.116
6.3%
jan 1, 1997
26.666
+7.834
41.6%
jan 1, 2003
22.044
-4.622
-17.33%
jan 1, 2004
22.623
+0.579
2.63%
jan 1, 2005
29.117
+6.494
28.71%
jan 1, 2006
28.999
-0.118
-0.4%
jan 1, 2007
29.501
+0.502
1.73%
jan 1, 2008
30.284
+0.783
2.65%
jan 1, 2009
31.021
+0.737
2.43%
jan 1, 2010
31.448
+0.427
1.38%
jan 1, 2011
32.329
+0.881
2.8%
jan 1, 2012
32.838
+0.509
1.57%
jan 1, 2013
33.699
+0.861
2.62%
jan 1, 2014
34.695
+0.996
2.95%
jan 1, 2015
31.407
-3.288
-9.48%
Ranking of countries by current statistics by years


Comments: