29
/
en
AIzaSyAYiBZKx7MnpbEhh9jyipgxe19OcubqV5w
April 1, 2024
267035
Trinidad and Tobago
TTO
true
2
1
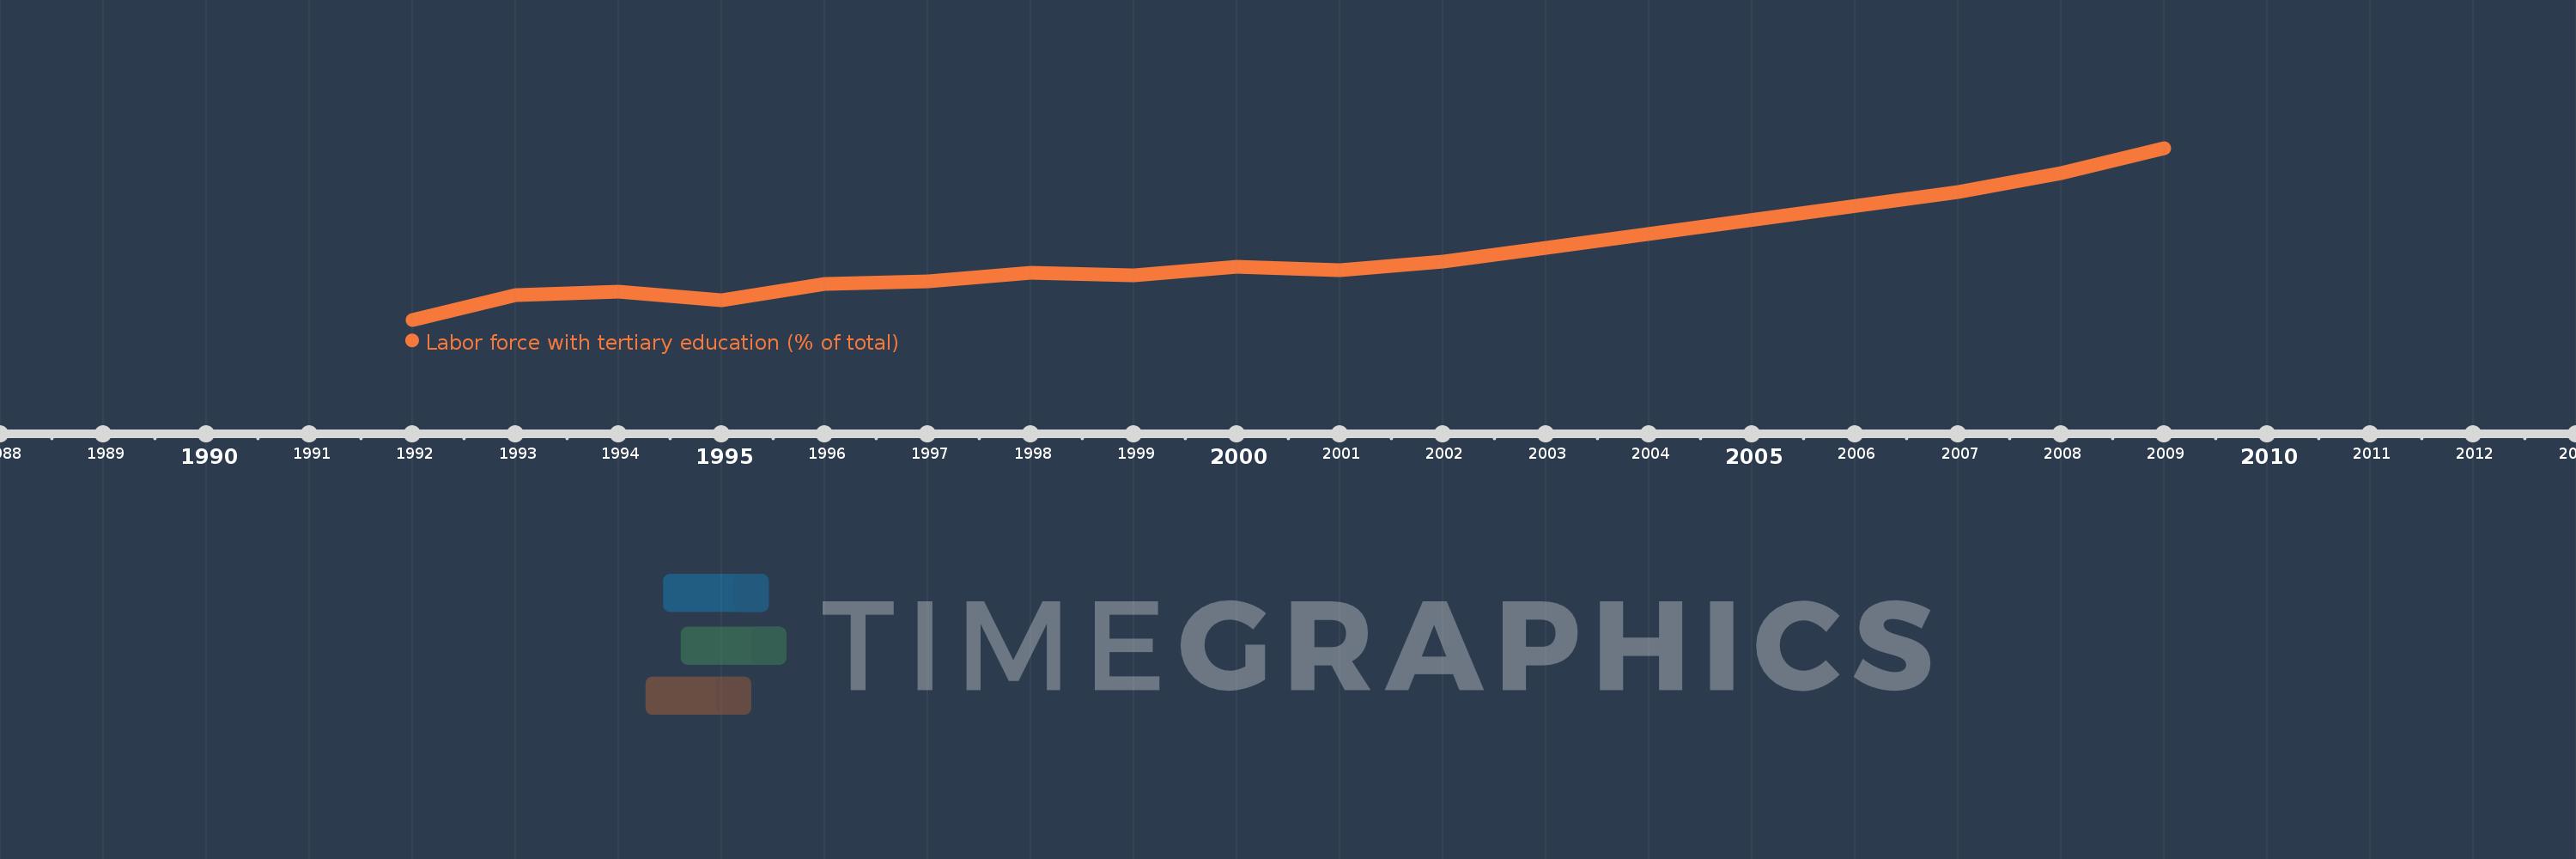
Labor force with tertiary education (% of total)
2009,2008,2007,2003,2002,2001,2000,1999,1998,1997,1996,1995,1994,1993,1992
This statistics in other country:
Timeline:
This timeline shows a graph from 1992 to 2009 of Trinidad and Tobago. No data until 1991. Number of actual observations by date: 15.
Source name:
World Development Indicators
Source organization:
International Labour Organization, Key Indicators of the Labour Market database.
Categories, topics:
Education, Social Protection & Labor
Last updated:
apr 23, 2017
Indicators value changes by year
At the date of observation
Value
Absolute change
Change from previous value
jan 1, 1993
5.8
+0.9
18.37%
jan 1, 1994
5.9
+0.1
1.72%
jan 1, 1995
5.6
-0.3
-5.08%
jan 1, 1996
6.2
+0.6
10.71%
jan 1, 1997
6.3
+0.1
1.61%
jan 1, 1998
6.6
+0.3
4.76%
jan 1, 1999
6.5
-0.1
-1.52%
jan 1, 2000
6.8
+0.3
4.62%
jan 1, 2001
6.7
-0.1
-1.47%
jan 1, 2002
7.0
+0.3
4.48%
jan 1, 2003
7.5
+0.5
7.14%
jan 1, 2007
9.5
+2.0
26.67%
jan 1, 2008
10.2
+0.7
7.37%
jan 1, 2009
11.1
+0.9
8.82%
Ranking of countries by current statistics by years


Comments: