29
/
en
AIzaSyAYiBZKx7MnpbEhh9jyipgxe19OcubqV5w
April 1, 2024
40161
IDA total
IDA
false
2
1
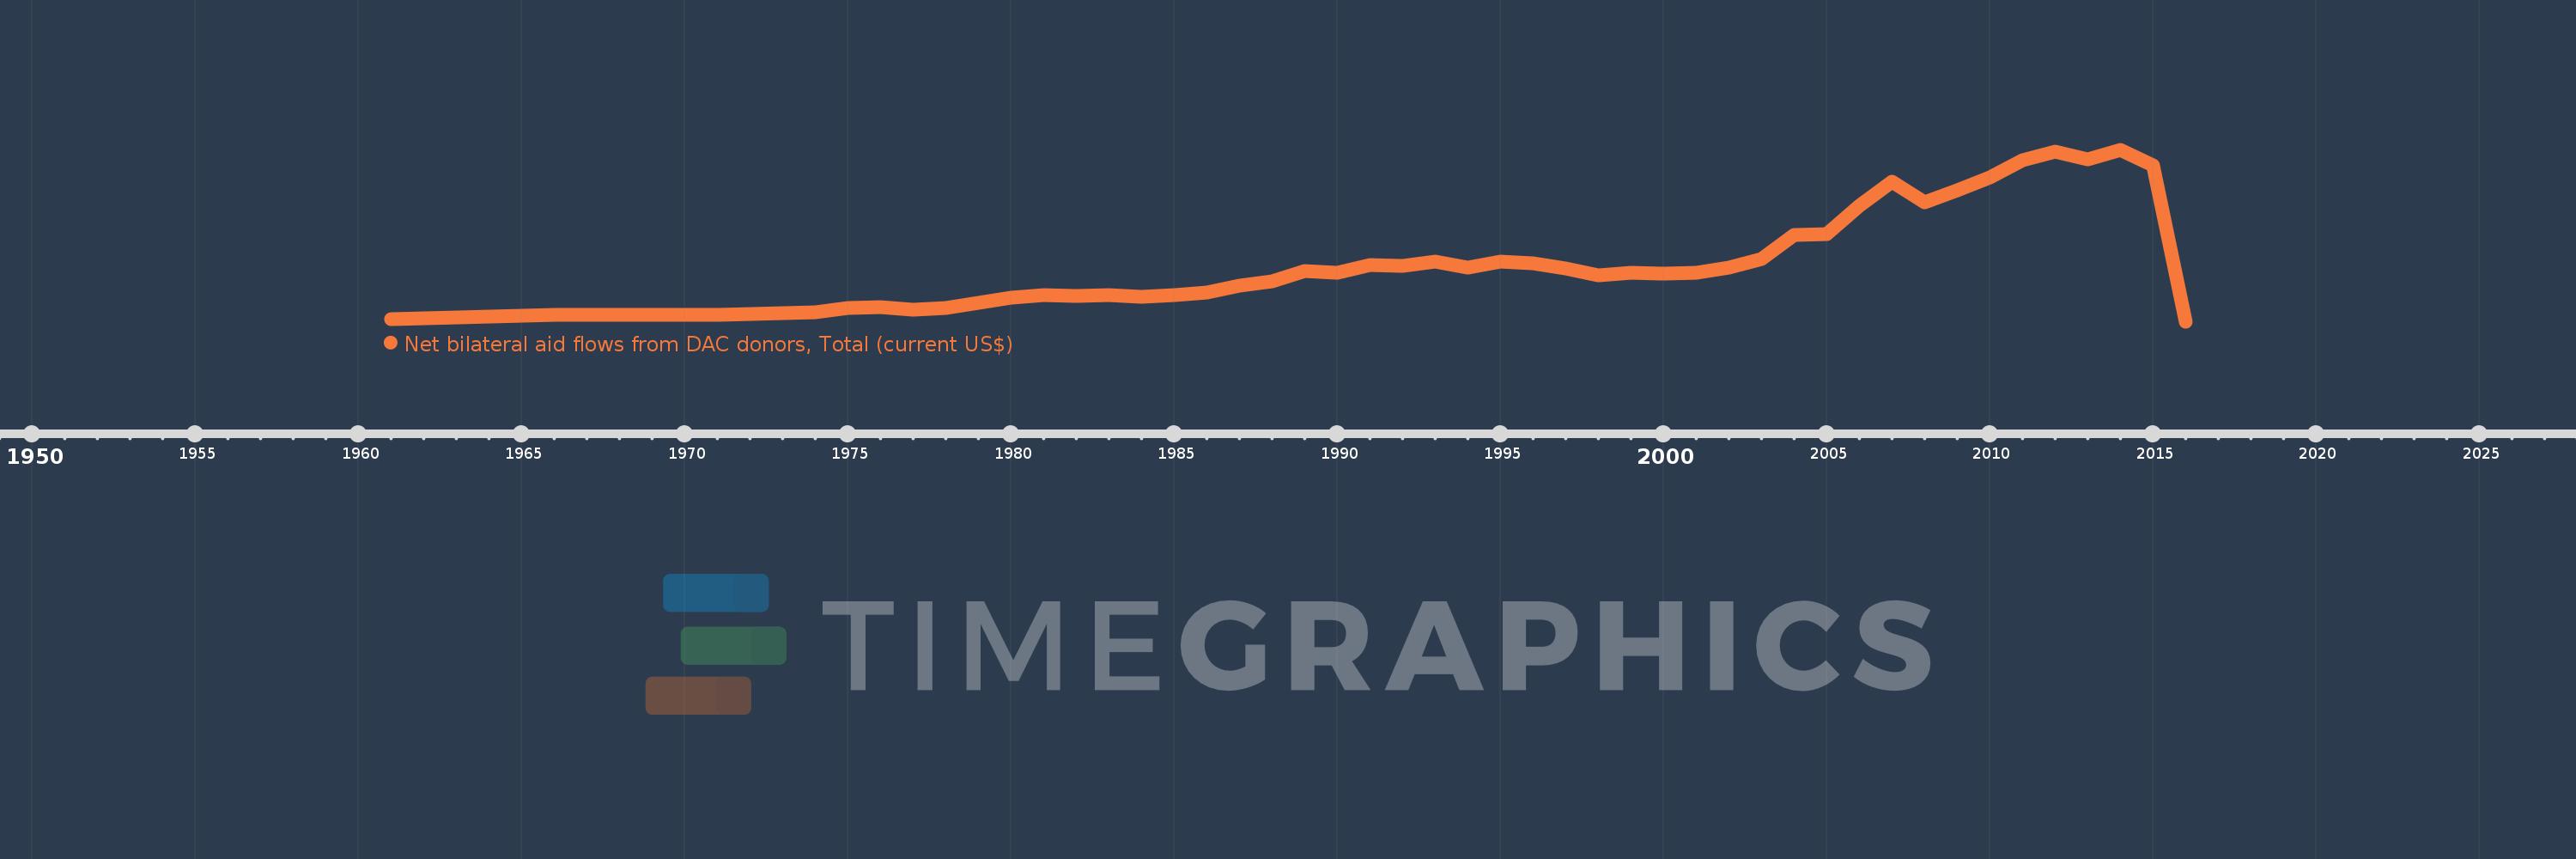
Net bilateral aid flows from DAC donors, Total (current US$)
2016,2015,2014,2013,2012,2011,2010,2009,2008,2007,2006,2005,2004,2003,2002,2001,2000,1999,1998,1997,1996,1995,1994,1993,1992,1991,1990,1989,1988,1987,1986,1985,1984,1983,1982,1981,1980,1979,1978,1977,1976,1975,1974,1973,1972,1971,1970,1969,1968,1967,1966,1965,1964,1963,1962,1961
This statistics in other country:
AfghanistanAlbaniaAlgeriaAngolaAntigua and BarbudaArab WorldArgentinaArmeniaArubaAzerbaijanBahamas, TheBahrainBangladeshBarbadosBelarusBelizeBeninBermudaBhutanBoliviaBosnia and HerzegovinaBotswanaBrazilBritish Virgin IslandsBrunei DarussalamBulgariaBurkina FasoBurundiCabo VerdeCambodiaCameroonCaribbean small statesCayman IslandsCentral African RepublicCentral Europe and the BalticsChadChileChinaColombiaComorosCongo, Dem. Rep.Congo, Rep.Costa RicaCote d'IvoireCroatiaCubaCyprusCzech RepublicDjiboutiDominicaDominican RepublicEast Asia & PacificEast Asia & Pacific (excluding high income)East Asia & Pacific (IDA & IBRD countries)EcuadorEgypt, Arab Rep.El SalvadorEquatorial GuineaEritreaEstoniaEthiopiaEuro areaEurope & Central AsiaEurope & Central Asia (excluding high income)Europe & Central Asia (IDA & IBRD countries)European UnionFijiFragile and conflict affected situationsFrench PolynesiaGabonGambia, TheGeorgiaGhanaGibraltarGrenadaGuatemalaGuineaGuinea-BissauGuyanaHaitiHeavily indebted poor countries (HIPC)High incomeHondurasHong Kong SAR, ChinaHungaryIBRD onlyIDA & IBRD totalIDA blendIDA onlyIDA totalIndiaIndonesiaIran, Islamic Rep.IraqIsraelJamaicaJordanKazakhstanKenyaKiribatiKorea, Dem. People’s Rep.Korea, Rep.KosovoKuwaitKyrgyz RepublicLao PDRLatin America & Caribbean Latin America & Caribbean (excluding high income)Latin America & the Caribbean (IDA & IBRD countries)LatviaLeast developed countries: UN classificationLebanonLesothoLiberiaLibyaLithuaniaLow & middle incomeLow incomeLower middle incomeMacao SAR, ChinaMacedonia, FYRMadagascarMalawiMalaysiaMaldivesMaliMaltaMarshall IslandsMauritaniaMauritiusMexicoMicronesia, Fed. Sts.Middle East & North AfricaMiddle East & North Africa (excluding high income)Middle East & North Africa (IDA & IBRD countries)Middle incomeMoldovaMongoliaMontenegroMoroccoMozambiqueMyanmarNamibiaNauruNepalNew CaledoniaNicaraguaNigerNigeriaNorth AmericaNorthern Mariana IslandsOECD membersOmanOther small statesPacific island small statesPakistanPalauPanamaPapua New GuineaParaguayPeruPhilippinesPolandQatarRomaniaRussian FederationRwandaSamoaSao Tome and PrincipeSaudi ArabiaSenegalSerbiaSeychellesSierra LeoneSingaporeSlovak RepublicSloveniaSmall statesSolomon IslandsSomaliaSouth AfricaSouth AsiaSouth Asia (IDA & IBRD)South SudanSri LankaSt. Kitts and NevisSt. LuciaSt. Vincent and the GrenadinesSub-Saharan Africa Sub-Saharan Africa (excluding high income)Sub-Saharan Africa (IDA & IBRD countries)SudanSurinameSwazilandSyrian Arab RepublicTajikistanTanzaniaThailandTimor-LesteTogoTongaTrinidad and TobagoTunisiaTurkeyTurkmenistanTurks and Caicos IslandsTuvaluUgandaUkraineUnited Arab EmiratesUpper middle incomeUruguayUzbekistanVanuatuVenezuela, RBVietnamWest Bank and GazaWorldYemen, Rep.ZambiaZimbabwe Timeline:
This timeline shows a graph from 1961 to 2016 of IDA total. No data until 1960. Number of actual observations by date: 56.
Source name:
World Development Indicators
Source organization:
Development Assistance Committee of the Organisation for Economic Co-operation and Development, Geographical Distribution of Financial Flows to Developing Countries, Development Co-operation Report, and International Development Statistics database. Data are available online at: www.oecd.org/dac/stats/idsonline.
Categories, topics:
Aid Effectiveness
Last updated:
apr 23, 2017
Indicators value changes by year
Maximum:
50.239 bln
jan 1, 2014
At the date of observation
Value
Absolute change
Change from previous value
jan 1, 1961
910.42 mln
+910.42 mln
0.0%
jan 1, 1962
1.041 bln
+130.5 mln
14.33%
jan 1, 1963
1.31 bln
+268.93 mln
25.84%
jan 1, 1964
1.47 bln
+159.94 mln
12.21%
jan 1, 1965
1.736 bln
+265.75 mln
18.08%
jan 1, 1966
2.02 bln
+284.65 mln
16.4%
jan 1, 1967
2.023 bln
+2.91 mln
0.14%
jan 1, 1968
2.113 bln
+90.38 mln
4.47%
jan 1, 1969
2.052 bln
-61.01 mln
-2.89%
jan 1, 1970
1.974 bln
-78.19 mln
-3.81%
jan 1, 1971
2.102 bln
+127.7 mln
6.47%
jan 1, 1972
2.265 bln
+163.31 mln
7.77%
jan 1, 1973
2.631 bln
+365.65 mln
16.14%
jan 1, 1974
2.956 bln
+325.31 mln
12.36%
jan 1, 1975
3.997 bln
+1.041 bln
35.21%
jan 1, 1976
4.421 bln
+424.16 mln
10.61%
jan 1, 1977
3.612 bln
-809.28 mln
-18.3%
jan 1, 1978
4.034 bln
+422.0 mln
11.68%
jan 1, 1979
5.532 bln
+1.498 bln
37.13%
jan 1, 1980
7.066 bln
+1.534 bln
27.73%
jan 1, 1981
7.749 bln
+682.85 mln
9.66%
jan 1, 1982
7.659 bln
-90.45 mln
-1.17%
jan 1, 1983
7.791 bln
+132.04 mln
1.72%
jan 1, 1984
7.335 bln
-455.58 mln
-5.85%
jan 1, 1985
7.799 bln
+464.14 mln
6.33%
jan 1, 1986
8.569 bln
+769.49 mln
9.87%
jan 1, 1987
10.748 bln
+2.179 bln
25.43%
jan 1, 1988
11.823 bln
+1.075 bln
10.01%
jan 1, 1989
14.774 bln
+2.951 bln
24.96%
jan 1, 1990
14.42 bln
-353.98 mln
-2.4%
jan 1, 1991
16.539 bln
+2.119 bln
14.7%
jan 1, 1992
16.331 bln
-208.68 mln
-1.26%
jan 1, 1993
17.602 bln
+1.271 bln
7.79%
jan 1, 1994
15.807 bln
-1.796 bln
-10.2%
jan 1, 1995
17.765 bln
+1.958 bln
12.39%
jan 1, 1996
17.204 bln
-560.53 mln
-3.16%
jan 1, 1997
15.681 bln
-1.523 bln
-8.85%
jan 1, 1998
13.667 bln
-2.014 bln
-12.84%
jan 1, 1999
14.497 bln
+829.88 mln
6.07%
jan 1, 2000
14.131 bln
-366.16 mln
-2.53%
jan 1, 2001
14.495 bln
+363.93 mln
2.58%
jan 1, 2002
15.922 bln
+1.428 bln
9.85%
jan 1, 2003
18.34 bln
+2.418 bln
15.19%
jan 1, 2004
25.419 bln
+7.078 bln
38.59%
jan 1, 2005
25.808 bln
+389.14 mln
1.53%
jan 1, 2006
34.014 bln
+8.206 bln
31.8%
jan 1, 2007
41.102 bln
+7.088 bln
20.84%
jan 1, 2008
35.005 bln
-6.097 bln
-14.83%
jan 1, 2009
38.618 bln
+3.612 bln
10.32%
jan 1, 2010
42.346 bln
+3.729 bln
9.66%
jan 1, 2011
47.21 bln
+4.864 bln
11.49%
jan 1, 2012
49.7 bln
+2.489 bln
5.27%
jan 1, 2013
47.498 bln
-2.202 bln
-4.43%
jan 1, 2014
50.239 bln
+2.741 bln
5.77%
jan 1, 2015
45.895 bln
-4.345 bln
-8.65%
jan 1, 2016
0.0
-45.895 bln
-100.0%
Ranking of countries by current statistics by years


Comments: